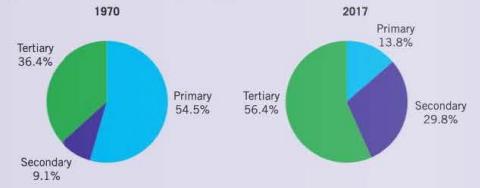
The following data illustrate how the structure of the Bangladesh economy has changed since 1970. The three
Question:
The following data illustrate how the structure of the Bangladesh economy has changed since 1970. The three pieces of the pie indicate the amount of GOP generated from each of the three sectors.

Using numbers from the charts in your explanation, comment on the changes that have occurred. How might income elasticity of demand have contributed to the change in the structure of the economy?
Fantastic news! We've Found the answer you've been seeking!
Step by Step Answer:
Related Book For 

Question Posted:


