Refer to the following table, in which Q d is the quantity of yen demanded, P is
Question:
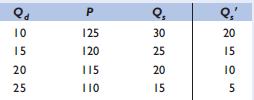
Refer to the following table, in which Q d is the quantity of yen demanded, P is the dollar price of yen, Q s is the quantity of yen supplied in year 1, and Q s 9 is the quantity of yen supplied in year 2. All quantities are in billions and the dollaryen exchange rate is fully flexible. LO3

a. What is the equilibrium dollar price of yen in year 1?
b. What is the equilibrium dollar price of yen in year 2?
c. Did the yen appreciate or did it depreciate relative to the dollar between years 1 and 2?
d. Did the dollar appreciate or did it depreciate relative to the yen between years 1 and 2?
e. Which one of the following could have caused the change in relative values of the dollar and yen between years 1 and 2: (1) More rapid inflation in the United States than in Japan, (2) an increase in the real interest rate in the United States but not in Japan, or (3) faster income growth in the United States than in Japan.
Step by Step Answer:

Economics Principles Problems And Policies
ISBN: 9780073511443
19th Edition
Authors: Campbell Mcconnell ,Stanley Brue ,Sean Flynn


