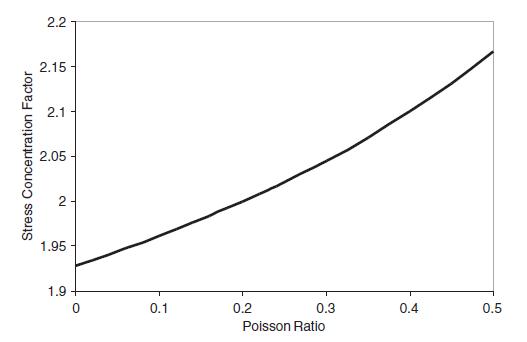
Generate plots of the stress concentration factor versus Poissons ratio (similar to Fig. 13.6) for each case
Question:
Generate plots of the stress concentration factor versus Poisson’s ratio (similar to Fig. 13.6) for each case in Exercise 13.26. Compare the results.
Fig 13.6

Data from exercise 13.26
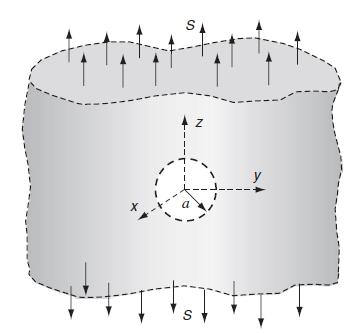
Consider the three-dimensional stress concentration problem given in Example 13.5. Recall that the maximum stresses occur on the boundary of the spherical cavity (r = a). With respect to the problem geometry shown in Fig. 13.5, the maximum stress component was found to be:

Fig 13.5

Other stress components can also be determined from the solution method outlined in the problem, and two particular components on the cavity boundary are:

a. Uniform uniaxial tension loadings of S along x and z directions:

b. Tension loading S along z axis and compression loading S along x directions:

c. Tension loadings of S along each Cartesian direction:

Step by Step Answer:

Elasticity Theory Applications And Numerics
ISBN: 9780128159873
4th Edition
Authors: Martin H. Sadd Ph.D.


