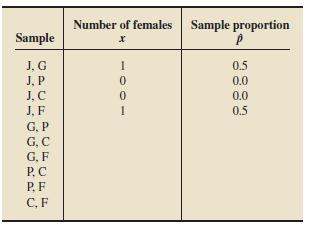
Repeat parts (b)(e) of Exercise 11.9 for samples of size 5. (b)(e) of Exercise 11.9 b. The
Question:
Repeat parts (b)–(e) of Exercise 11.9 for samples of size 5.
(b)–(e) of Exercise 11.9
b. The first column of the following table provides the possible samples of size 2, where each person is represented by the first letter of his or her first name; the second column gives the number of successes—the number of females obtained—for each sample, and the third column shows the sample proportion. Complete the table.

c. Construct a dot plot for the sampling distribution of the proportion for samples of size 2. Mark the position of the population proportion on the dot plot.
d. Use the third column of the table to obtain the mean of the variable.
e. Compare your answers from parts (a) and (d). Why are they the same?
Fantastic news! We've Found the answer you've been seeking!
Step by Step Answer:
Related Book For 

Question Posted:


