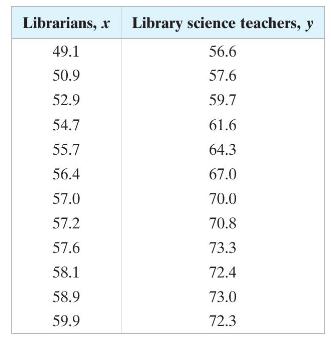
Find the equation of the regression line for the data. Draw the regression line on the scatter
Question:
Find the equation of the regression line for the data. Draw the regression line on the scatter plot that you constructed in Exercise 2.
Use the data in the table, which shows the average annual salaries (both in thousands of dollars) for librarians and postsecondary library science teachers in the United States for 12 years.

Data from Exercises 2
Construct a scatter plot for the data. Do the data appear to have a positive linear correlation, a negative linear correlation, or no linear correlation? Explain.
Step by Step Answer:
Related Book For 

Elementary Statistics Picturing The World
ISBN: 9781292260464
7th Global Edition
Authors: Betsy Farber, Ron Larson
Question Posted:


