In a recent year, according to the Bureau of Labor Statistics, the median number of years that
Question:
In a recent year, according to the Bureau of Labor Statistics, the median number of years that wage and salary workers had been with their current employer (called employee tenure) was 4.2 years. Information on employee tenure has been gathered since 1996 using the Current Population Survey (CPS), a monthly survey of about 60,000 households that provides information on employment, unemployment, earnings, demographics, and other characteristics of the U.S. population ages 16 and over. With respect to employee tenure, the questions measure how long workers have been with their current employers, not how long they plan to stay with their employers.
 EXERCISES
1. (a) What sampling technique would you use to select the sample for the CPS?
(b) Do you think the technique in part
(a) will give you a sample that is representative of the U.S. population? Why or why not?
(c) Identify possible flaws or biases in the survey on the basis of the technique you chose in part (a).
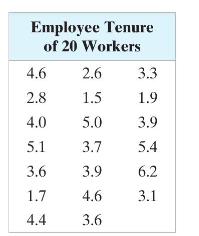
2. A congressional representative claims that the median tenure for workers from the representative's district is less than the national median tenure of 4.2 years. The claim is based on the representative's data, which is shown in the table at the right above. (Assume that the employees were randomly selected.)

(a) Is it possible that the claim is true? What questions should you ask about how the data were collected?
(b) How would you test the representative's claim? Can you use a parametric test, or do you need to use a nonparametric test?
(c) State the null hypothesis and the alternative hypothesis.
(d) Test the claim using \(\alpha=0.05\). What can you conclude?
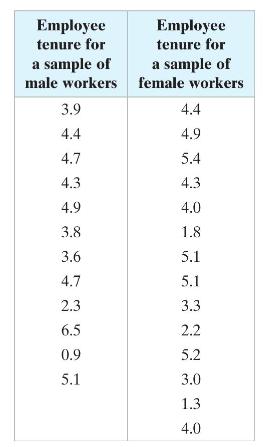
3. A congressional representative claims that there is a difference between the median tenures for male workers and female workers. The claim is based on the representative's data, which is shown in the table at the right. (Assume that the employees were randomly selected from the representative's district.)

(a) How would you test the representative's claim? Can you use a parametric test, or do you need to use a nonparametric test?
(b) State the null hypothesis and the alternative hypothesis.
(c) Test the claim using \(\alpha=0.05\). What can you conclude?
Step by Step Answer:

Elementary Statistics Picturing The World
ISBN: 9781292260464
7th Global Edition
Authors: Betsy Farber, Ron Larson


