

Question: On graph paper, draw both a histogram and a frequency polygon to illustrate the following distribution of IQ scores: Class Interval 130-144 115-129 100-114 f
On graph paper, draw both a histogram and a frequency polygon to illustrate the following distribution of IQ scores:
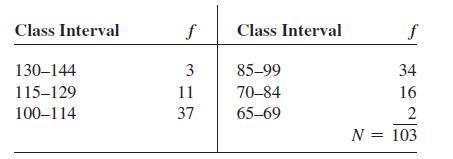
Class Interval 130-144 115-129 100-114 f 3 11 37 Class Interval 85-99 70-84 65-69 f 34 16 2 N = 103
Step by Step Solution
★★★★★
3.48 Rating (168 Votes )
There are 3 Steps involved in it
1 Expert Approved Answer
Step: 1 Unlock

create a histogram you need to first divide the data into intervals or bins and then draw rectangles ... View full answer
Question Has Been Solved by an Expert!
Get step-by-step solutions from verified subject matter experts
Step: 2 Unlock
Step: 3 Unlock