

Question: Use a dot plot to organize the data set in Example 1. Describe any patterns. Data from Example 1 The data set at the left
Use a dot plot to organize the data set in Example 1. Describe any patterns.
Data from Example 1
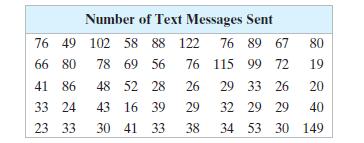
The data set at the left lists the numbers of text messages sent in one day by 50 cell phone users. Display the data in a stem-and-leaf plot. Describe any patterns.
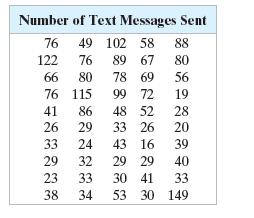
Number of Text Messages Sent 76 49 102 58 88 122 76 89 67 80 66 80 78 69 56 76 115 99 72 19 41 86 48 52 28 26 29 33 26 20 33 24 43 16 39 29 32 29 29 40 23 33 30 41 33 38 34 53 30 149
Step by Step Solution
There are 3 Steps involved in it
So that each data entry is included in the dot plot the horizontal axis should include num... View full answer

Get step-by-step solutions from verified subject matter experts