

Question: Use a scatter plot to display the data shown in the table at the left. The data represent the numbers of coaching hours and the
Use a scatter plot to display the data shown in the table at the left. The data represent the numbers of coaching hours and the hourly fees (in dollars) of 12 cricket coaches.
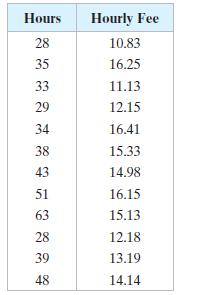
Organize the data using the indicated type of graph. Describe any patterns.
Hours Hourly Fee 28 10.83 35 16.25 33 11.13 29 12.15 34 16.41 38 15.33 43 14.98 51 16.15 63 15.13 28 12.18 39 13.19 48 14.14
Step by Step Solution
★★★★★
3.40 Rating (156 Votes )
There are 3 Steps involved in it
1 Expert Approved Answer
Step: 1 Unlock

Question Has Been Solved by an Expert!
Get step-by-step solutions from verified subject matter experts
Step: 2 Unlock
Step: 3 Unlock