

Question: Using the frequency distribution constructed in Example 1, find the midpoint, relative frequency, and cumulative frequency of each class. Describe any patterns. Data from Example
Using the frequency distribution constructed in Example 1, find the midpoint, relative frequency, and cumulative frequency of each class. Describe any patterns.
Data from Example 1
The data set lists the out-of-pocket prescription medicine expenses (in dollars) for 30 U.S. adults in a recent year. Construct a frequency distribution that has seven classes.
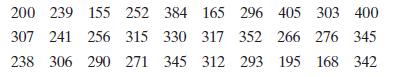
200 239 155 252 384 165 296 405 303 400 307 241 256 315 330 317 352 266 276 345 238 306 290 271 345 312 293 195 168 342
Step by Step Solution
★★★★★
3.37 Rating (156 Votes )
There are 3 Steps involved in it
1 Expert Approved Answer
Step: 1 Unlock

Question Has Been Solved by an Expert!
Get step-by-step solutions from verified subject matter experts
Step: 2 Unlock
Step: 3 Unlock