

Question: According to the least-squares property, the regression line minimizes the sum of the squares of the residuals. Refer to Data Set 1 in Appendix B
According to the least-squares property, the regression line minimizes the sum of the squares of the residuals. Refer to Data Set 1 in Appendix B and use the paired data consisting of the first six pulse rates and the first six systolic blood pressures of males.
a. Find the equation of the regression line.
b. Identify the residuals, and find the sum of squares of the residuals.
c. Show that the equation y = 70 + 0.5x results in a larger sum of squares of residuals.
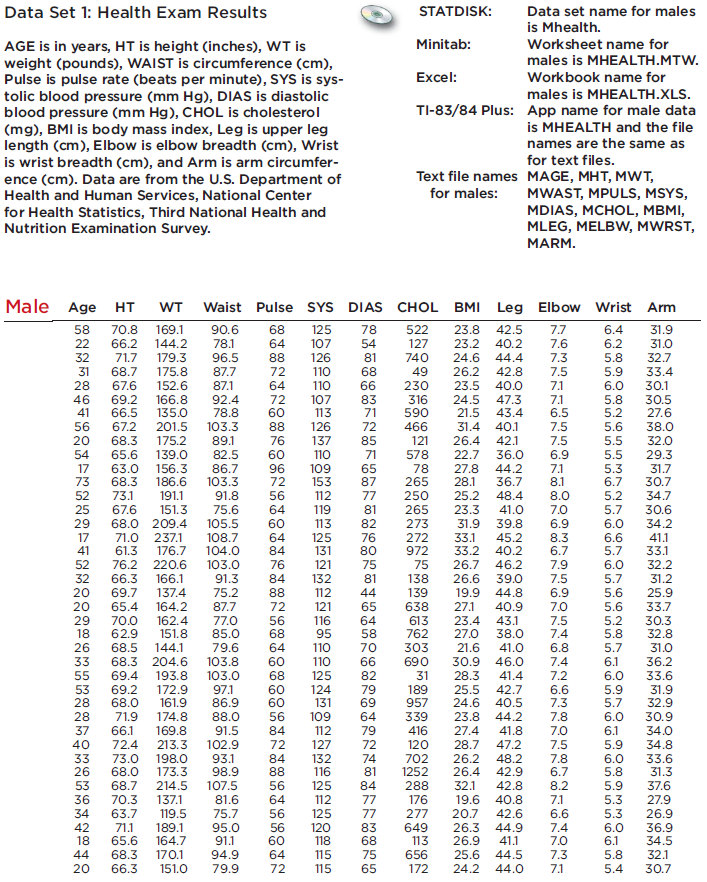
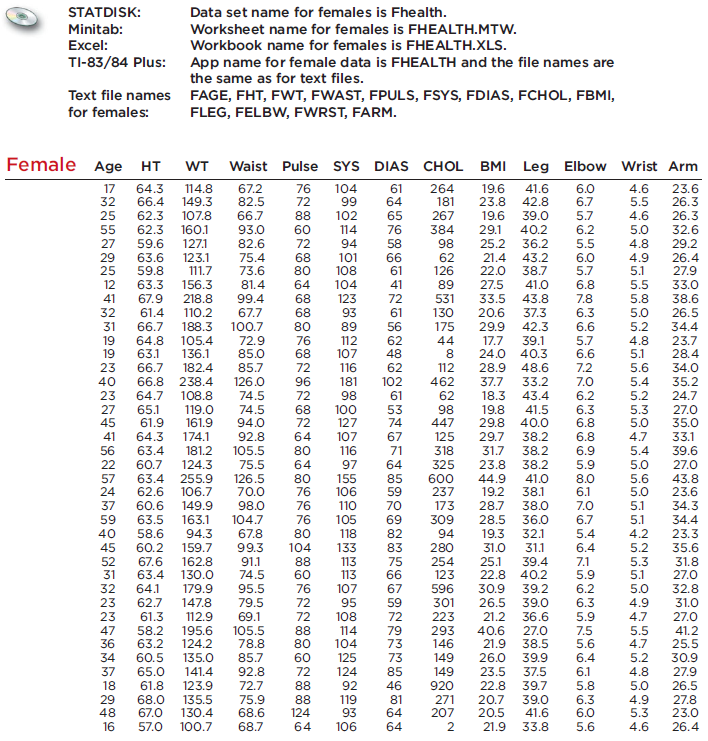
Data Set 1: Health Exam Results AGE is in years, HT is height (inches), WT is weight (pounds), WAIST is circumference (cm), Pulse is pulse rate (beats per minute), SYS is sys- tolic blood pressure (mm Hg), DIAS is diastolic blood pressure (mm Hg), CHOL is cholesterol (mg), BMI is body mass index, Leg is upper leg length (cm), Elbow is elbow breadth (cm), Wrist is wrist breadth (cm), and Arm is arm circumfer- ence (cm). Data are from the U.S. Department of Health and Human Services, National Center for Health Statistics, Third National Health and Nutrition Examination Survey. 58 70.8 169.1 90.6 68 125 22 66.2 144.2 78.1 64 32 71.7 179.3 96.5 88 126 31 68.7 175.8 87.7 72 110 28 67.6 152.6 87.1 64 110 72 107 46 69.2 166.8 92.4 41 66.5 135.0 78.8 60 56 67.2 201.5 103.3 20 68.3 175.2 89.1 Male Age HT WT Waist Pulse SYS DIAS CHOL 54 65.6 139.0 82.5 60 17 63.0 156.3 86.7 96 73 68.3 186.6 103.3 72 52 73.1 191.1 91.8 56 25 67.6 151.3 75.6 64 119 29 68.0 209.4 105.5 60 113 17 71.0 237.1 108.7 41 61.3 176.7 104.0 84 131 32 66.3 166.1 20 20 28 7 40 325 3376442184 20 37 52 76.2 220.6 103.0 76 121 33 73.0 26 68.0 53 68.7 63.7 119.5 71.1 189.1 65.6 164.7 113 88 126 76 137 110 91.3 69.7 137.4 75.2 88 112 65.4 164.2 29 70.0 162.4 18 62.9 151.8 26 68.5 144.1 33 68.3 204.6 103.8 60 110 55 69.4 193.8 103.0 68 125 82 53 69.2 172.9 97.1 28 68.0 161.9 86.9 60 124 60 56 109 71.9 66.1 174.8 88.0 169.8 91.5 84 72.4 213.3 102.9 72 127 198.0 93.1 84 132 98.9 88 116 173.3 214.5 107.5 56 125 36 70.3 137.1 81.6 75.7 95.0 91.1 94.9 79.9 68.3 170.1 107 66.3 151.0 109 153 64 125 87.7 77.0 56 85.0 68 79.6 112 84 132 64 56 72 121 116 95 64 110 131 112 112 125 56 120 60 118 64 115 78468651728576578275 80 584 654 58 70 668279 89479724547756875 65 72 115 83 75 STATDISK: Minitab: Excel: males is MHEALTH.XLS. TI-83/84 Plus: App name for male data is MHEALTH and the file names are the same as for text files. MAGE, MHT, MWT, MWAST, MPULS, MSYS, MDIAS, MCHOL, MBMI, MLEG, MELBW, MWRST, MARM. Text file names for males: 522 127 740 BMI 23.8 42.5 7.7 23.2 40.2 7.6 24.6 44.4 7.3 7.5 26.2 42.8 23.5 40.0 24.5 47.3 7.1 7.1 21.5 43.4 6.5 7.5 31.4 40.1 26.4 42.1 22.7 36.0 121 578 78 7.5 6.9 7.1 8.1 265 250 265 27.8 44.2 28.1 36.7 25.2 48.4 23.3 41.0 8.0 7.0 273 31.9 39.8 6.9 33.1 45.2 8.3 272 972 33.2 40.2 6.7 75 26.7 46.2 7.9 26.6 39.0 7.5 19.9 44.8 27.1 6.9 49 230 316 590 466 81 138 44 139 638 613 40.9 7.0 43.1 7.5 38.0 7.4 6.8 30.9 46.0 7.4 28.3 41.4 7.2 25.5 42.7 6.6 416 24.6 40.5 7.3 23.8 44.2 7.8 27.4 41.8 7.0 120 28.7 47.2 7.5 26.2 48.2 26.4 42.9 6.7 702 7.8 81 1252 288 176 32.1 42.8 8.2 7.1 277 6.6 7.4 19.6 40.8 20.7 42.6 83 649 26.3 44.9 113 26.9 41.1 656 25.6 44.5 7.3 172 24.2 44.0 7.1 7.0 762 303 690 31 189 957 Data set name for males is Mhealth. Worksheet name for males is MHEALTH.MTW. Workbook name for Leg Elbow Wrist Arm 6.4 31.9 6.2 31.0 5.8 32.7 33.4 30.1 30.5 27.6 339 23.4 27.0 21.6 41.0 60 00 5.9 6.0 5.8 5.2 5.6 38.0 5.5 5.5 5.3 6.7 5.2 5.7 6.0 6.6 5.7 6.0 5.9 6.0 5.8 32.0 29.3 5.7 5.6 5.6 5.2 5.8 5.7 6.1 6.0 5.9 5.7 6.0 30.9 6.1 34.0 34.8 33.6 31.3 5.9 5.3 31.7 30.7 34.7 30.6 34.2 41.1 33.1 32.2 31.2 25.9 33.7 30.3 32.8 31.0 36.2 33.6 31.9 32.9 37.6 27.9 5.3 26.9 6.0 6.1 5.8 5.4 36.9 34.5 32.1 30.7 STATDISK: Minitab: Excel: TI-83/84 Plus: Text file names for females: Female Age HT -732 25 55 27 29 25 12 4 32 59.8 12 63.3 41 67.9 61.4 17 64.3 66.4 149.3 82.5 62.3 107.8 66.7 160.1 93.0 27 59.6 127.1 82.6 62.3 63.6 123.1 75.4 73.6 81.4 31 66.7 19 19 Data set name for females is Fhealth. Worksheet name for females is FHEALTH.MTW. Workbook name for females is FHEALTH.XLS. 64.8 63.1 App name for female data is FHEALTH and the file names are the same as for text files. FAGE, FHT, FWT, FWAST, FPULS, FSYS, FDIAS, FCHOL, FBMI, FLEG, FELBW, FWRST, FARM. WT Waist Pulse SYS DIAS 114.8 67.2 76 104 61 72 99 88 102 114 94 58 111.7 156.3 218.8 110.2 188.3 100.7 105.4 136.1 99.4 67.7 23 66.7 182.4 85.7 40 66.8 238.4 126.0 37 60.6 149.9 59 63.5 163.1 40 58.6 94.3 45 60.2 159.7 23 64.7 108.8 74.5 27 65.1 119.0 45 61.9 161.9 41 64.3 174.1 56 63.4 181.2 22 60.7 124.3 57 63.4 255.9 24 62.6 106.7 67.6 162.8 63.4 130.0 72.9 76 85.0 68 107 116 181 72 98 74.5 68 100 94.0 72 127 92.8 64 107 105.5 80 116 75.5 64 97 155 106 110 105 118 126.5 70.0 98.0 104.7 67.8 99.3 60 72 68 101 80 108 64 104 68 123 68 80 91.1 74.5 72 96 80 76 76 76 52 31 32 64.1 179.9 95.5 76 79.5 72 23 62.7 147.8 23 61.3 112.9 69.1 72 80 104 88 60 93 89 112 47 58.2 195.6 105.5 88 36 63.2 124.2 34 60.5 135.0 37 65.0 141.4 18 61.8 123.9 29 68.0 135.5 75.9 48 67.0 130.4 68.6 16 57.0 100.7 68.7 133 113 113 107 95 108 114 78.8 80 104 85.7 60 125 92.8 72 124 72.7 88 88 119 92 124 93 64 106 64 65 76 66 61 41 72 61 56 62 48 62 102 61 53 74 67 71 83 75 64 85 600 59 237 66 70 173 69 309 82 94 280 254 123 CHOL 264 181 267 384 98 62 126 89 531 130 175 44 29 8568464 8 67 596 59 301 72 223 79 293 73 146 81 73 149 149 920 112 462 62 98 447 125 318 325 23.8 44.9 19.2 BMI Leg Elbow Wrist Arm 19.6 41.6 6.0 4.6 23.6 23.8 42.8 6.7 5.5 26.3 19.6 39.0 5.7 4.6 26.3 29.1 40.2 6.2 5.0 32.6 25.2 36.2 5.5 4.8 21.4 43.2 4.9 22.0 38.7 5.1 271 207 2 27.5 41.0 6.8 7.8 33.5 43.8 20.6 37.3 6.3 29.9 42.3 6.6 6.0 5.7 17.7 39.1 5.7 24.0 40.3 6.6 28.9 48.6 37.7 33.2 18.3 43.4 19.8 41.5 29.8 40.0 29.7 38.2 31.7 28.7 28.5 19.3 31.0 31.1 7.2 7.0 6.2 6.3 6.8 6.8 38.2 6.9 38.2 5.9 41.0 38.1 38.0 36.0 32.1 8.0 6.1 7.0 6.7 5.4 6.4 7.1 5.9 6.2 25.1 39.4 22.8 40.2 30.9 39.2 26.5 39.0 21.2 36.6 40.6 27.0 7.5 21.9 38.5 5.6 26.0 39.9 6.4 23.5 37.5 6.1 22.8 39.7 5.8 20.7 39.0 6.3 20.5 41.6 6.0 21.9 33.8 5.6 5.5 5.8 5.0 5.2 4.8 5.1 5.6 5.4 5.2 5.3 5.0 4.7 5.4 5.0 5.6 5.0 5.1 5.1 4.2 5.2 5.3 5.1 5.0 6.3 4.9 5.9 4.7 5.5 4.7 5.2 4.8 5.0 4.9 5.3 4.6 29.2 26.4 27.9 33.0 38.6 26.5 34.4 23.7 28.4 34.0 35.2 24.7 27.0 35.0 33.1 39.6 27.0 43.8 23.6 34.3 34.4 23.3 35.6 31.8 27.0 32.8 31.0 27.0 41.2 25.5 30.9 27.9 26.5 27.8 23.0 26.4
Step by Step Solution
3.28 Rating (157 Votes )
There are 3 Steps involved in it
a The equation of the regression line is y 715 02x b The res... View full answer

Get step-by-step solutions from verified subject matter experts