

Question: Given that the F test is not robust against departures from normality, it becomes necessary to verify that the two samples are from populations having
Given that the F test is not robust against departures from normality, it becomes necessary to verify that the two samples are from populations having distributions that are quite close to normal distributions. Assume that you want to test the claim of equal standard deviations using the samples of cholesterol levels of men and women listed in Data Set 1 in Appendix B. What are some methods that can be used to test for normality?
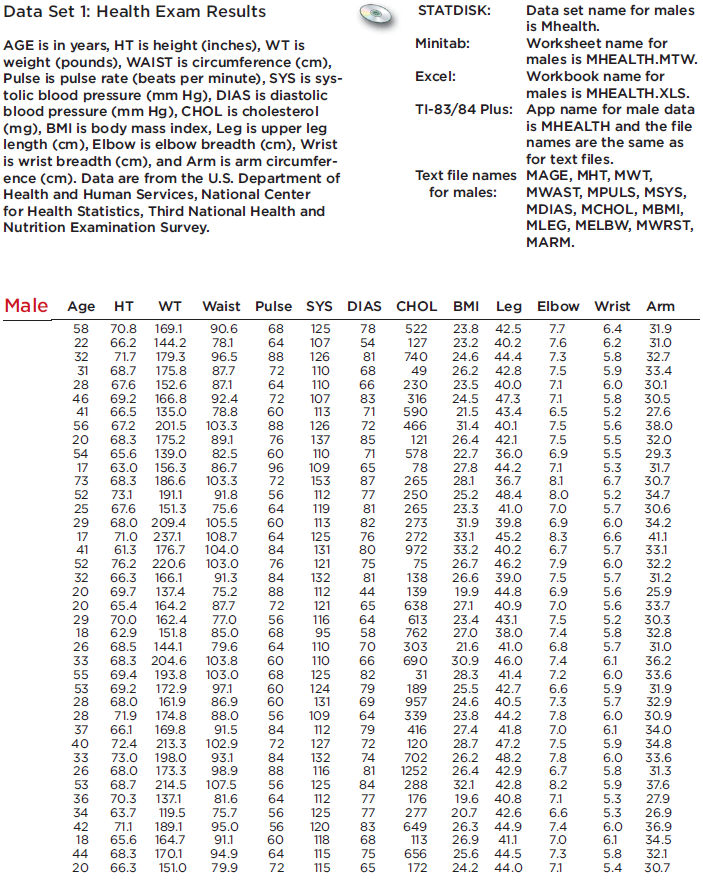
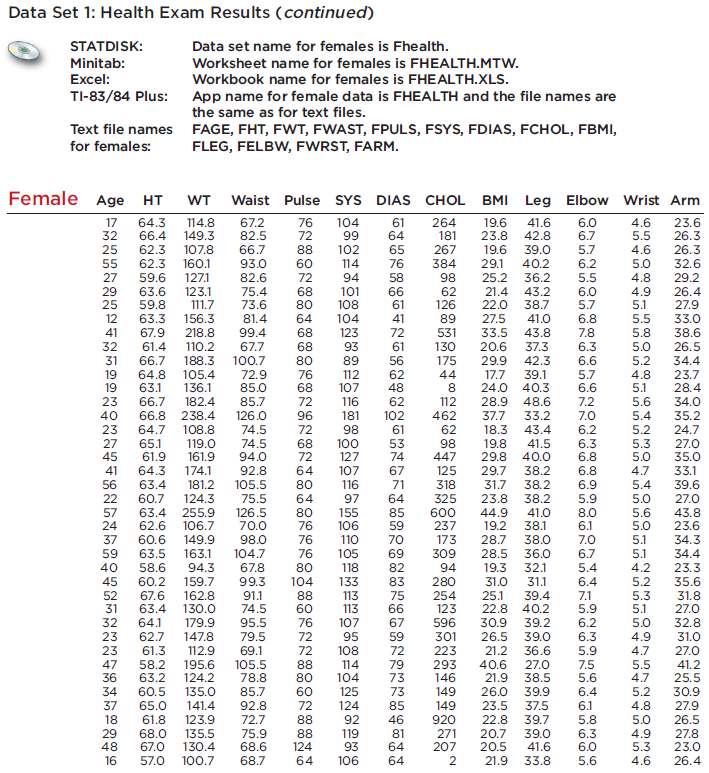
Data Set 1: Health Exam Results AGE is in years, HT is height (inches), WT is weight (pounds), WAIST is circumference (cm), Pulse is pulse rate (beats per minute), SYS is sys- tolic blood pressure (mm Hg), DIAS is diastolic blood pressure (mm Hg), CHOL is cholesterol (mg), BMI is body mass index, Leg is upper leg length (cm), Elbow is elbow breadth (cm), Wrist is wrist breadth (cm), and Arm is arm circumfer- ence (cm). Data are from the U.S. Department of Health and Human Services, National Center for Health Statistics, Third National Health and Nutrition Examination Survey. Male Age HT WT Waist Pulse SYS DIAS 58 70.8 169.1 90.6 68 125 78 22 66.2 144.2 78.1 64 107 54 32 71.7 179.3 96.5 88 126 31 68.7 175.8 87.7 72 110 87.1 28 67.6 152.6 64 110 46 69.2 166.8 92.4 72 107 41 66.5 135.0 60 113 78.8 56 67.2 201.5 103.3 20 68.3 175.2 89.1 76 54 65.6 139.0 82.5 60 17 63.0 156.3 86.7 96 73 68.3 186.6 103.3 72 52 73.1 191.1 91.8 56 25 67.6 151.3 75.6 64 29 68.0 209.4 105.5 60 108.7 64 125 17 71.0 237.1 41 61.3 52 76.2 220.6 88 126 53 69.2 172.9 28 28 34 42 18 137 110 77.0 85.0 68 109 97.1 68.0 161.9 86.9 60 153 112 176.7 104.0 84 131 103.0 76 121 32 66.3 166.1 91.3 20 69.7 137.4 75.2 20 65.4 164.2 87.7 29 70.0 162.4 18 62.9 151.8 68.5 144.1 26 33 68.3 204.6 103.8 55 69.4 193.8 103.0 119 113 84 132 88 72 56 116 112 121 95 79.6 64 60 68 125 110 110 131 71.9 174.8 88.0 56 109 169.8 91.5 84 37 66.1 40 72.4 213.3 102.9 33 73.0 198.0 93.1 26 68.0 173.3 98.9 88 116 53 68.7 214.5 107.5 56 125 70.3 137.1 36 63.7 119.5 71.1 189.1 95.0 65.6 164.7 91.1 44 68.3 170.1 94.9 20 66.3 151.0 79.9 112 72 127 60 124 79 84 132 81.6 64 75.7 56 125 112 6866 372 85765826807554654587062796949244 5 68 75 65 72 115 81 BMI Leg Elbow Wrist Arm 23.8 42.5 7.7 6.4 31.9 23.2 40.2 7.6 6.2 31.0 24.6 44.4 7.3 5.8 32.7 26.2 42.8 7.5 5.9 33.4 23.5 40.0 7.1 6.0 30.1 24.5 47.3 7.1 5.8 30.5 21.5 43.4 6.5 5.2 27.6 31.4 40.1 7.5 5.6 38.0 42.1 7.5 5.5 32.0 36.0 6.9 5.5 29.3 44.2 7.1 28.1 36.7 8.1 25.2 48.4 8.0 265 23.3 41.0 7.0 273 31.9 39.8 6.9 272 33.1 45.2 8.3 80 972 33.2 40.2 6.7 75 75 81 138 26.7 46.2 7.9 26.6 39.0 7.5 5.7 19.9 44.8 6.9 5.6 27.1 40.9 7.0 5.6 33.7 23.4 43.1 7.5 5.2 30.3 27.0 38.0 7.4 5.8 32.8 5.7 6.1 6.0 83 71 STATDISK: Data set name for males is Mhealth. Minitab: Worksheet name for males is MHEALTH.MTW. Workbook name for males is MHEALTH.XLS. TI-83/84 Plus: App name for male data Excel: is MHEALTH and the file names are the same as for text files. MAGE, MHT, MWT, MWAST, MPULS, MSYS, MDIAS, MCHOL, MBMI, MLEG, MELBW, MWRST, MARM. 81 Text file names for males: 466 121 71 578 CHOL 522 127 740 49 230 316 590 78 265 250 139 638 613 762 303 21.6 41.0 6.8 46.0 7.4 690 31 30.9 28.3 41.4 7.2 6.6 7.3 7.8 41.8 7.0 47.2 7.5 48.2 7.8 42.9 6.7 42.8 8.2 40.8 7.1 19.6 20.7 42.6 6.6 26.3 44.9 26.9 41.1 7.4 7.0 656 25.6 44.5 7.3 44.0 172 24.2 7.1 26.4 22.7 27.8 189 25.5 42.7 957 24.6 40.5 44.2 339 23.8 416 27.4 120 28.7 702 26.2 26.4 288 32.1 176 81 1252 77 277 83 649 56 120 60 118 68 113 64 115 5.3 6.7 5.2 5.7 6.0 6.6 5.7 6.0 31.7 30.7 34.7 30.6 34.2 41.1 33.1 32.2 31.2 25.9 31.0 36.2 33.6 5.9 31.9 5.7 32.9 6.0 6.1 5.9 30.9 34.0 34.8 33.6 31.3 37.6 27.9 6.0 5.8 5.9 5.3 5.3 26.9 6.0 36.9 6.1 34.5 5.8 32.1 5.4 30.7 Data Set 1: Health Exam Results (continued) STATDISK: Minitab: Excel: TI-83/84 Plus: Text file names for females: Female Age HT Data set name for females is Fhealth. Worksheet name for females is FHEALTH.MTW. Workbook name for females is FHEALTH.XLS. App name for female data is FHEALTH and the file names are the same as for text files. FAGE, FHT, FWT, FWAST, FPULS, FSYS, FDIAS, FCHOL, FBMI, FLEG, FELBW, FWRST, FARM. 17 64.3 114.8 67.2 32 66.4 149.3 82.5 66.7 19 19 WT Waist Pulse SYS DIAS 76 104 61 72 99 88 60 72 68 80 108 64 104 68 123 68 93 93.0 25 62.3 107.8 55 62.3 160.1 27 59.6 127.1 82.6 29 63.6 123.1 75.4 59.8 111.7 73.6 81.4 218.8 99.4 61.4 110.2 67.7 31 66.7 188.3 100.7 25 63.3 156.3 12 41 67.9 32 64.8 105.4 63.1 136.1 23 66.7 182.4 40 66.8 238.4 126.0 23 64.7 108.8 27 45 41 65.1 61.9 161.9 64.3 174.1 181.2 105.5 74.5 72 119.0 74.5 68 100 94.0 92.8 72 127 64 107 80 116 23 61.3 112.9 47 58.2 195.6 105.5 36 63.2 124.2 34 60.5 135.0 37 65.0 141.4 18 61.8 123.9 29 68.0 135.5 48 16 102 114 88 78.8 80 85.7 60 92.8 72.7 75.9 67.0 130.4 68.6 57.0 100.7 68.7 94 124 64 80 89 56 72.9 76 112 85.0 68 107 48 72 116 85.7 96 181 101 66 98 72 108 97 95 56 63.4 22 60.7 124.3 75.5 64 57 63.4 255.9 126.5 80 155 600 24 62.6 106.7 70.0 76 106 59 237 37 60.6 149.9 98.0 76 173 110 76 105 69 309 80 94 59 63.5 163.1 104.7 40 58.6 94.3 67.8 45 60.2 159.7 99.3 52 67.6 162.8 91.1 74.5 60 118 104 133 83 280 88 113 75 254 123 31 63.4 130.0 113 32 64.1 179.9 95.5 76 107 67 596 23 62.7 147.8 72 79.5 69.1 114 104 72 124 88 88 125 92 64 119 65686642 5662486210253416459069235692293325664 64 93 76 106 61 41 72 74 67 71 CHOL BMI Leg Elbow Wrist Arm 4.6 264 181 5.5 19.6 41.6 6.0 23.8 42.8 6.7 19.6 39.0 5.7 29.1 40.2 6.2 267 4.6 384 5.0 4.8 98 62 25.2 36.2 5.5 21.4 43.2 6.0 22.0 38.7 5.7 4.9 126 5.1 27.5 41.0 6.8 5.5 89 531 5.8 130 20.6 33.5 43.8 37.3 175 29.9 42.3 6.6 5.0 5.2 44 17.7 39.1 5.7 4.8 24.0 40.3 6.6 5.1 8 112 28.9 48.6 7.2 5.6 462 37.7 33.2 7.0 5.4 62 18.3 43.4 6.2 5.2 98 6.3 5.3 447 6.8 125 318 325 70 301 72 223 79 293 73 146 73 149 19.8 41.5 29.8 40.0 29.7 38.2 31.7 38.2 149 23.8 38.2 44.9 41.0 19.2 38.1 28.7 38.0 7.8 6.3 7.1 5.9 30.9 39.2 6.2 26.5 39.0 6.3 21.2 36.6 5.9 40.6 27.0 7.5 5.6 6.4 6.1 21.9 38.5 26.0 39.9 23.5 37.5 920 22.8 39.7 5.8 271 20.7 39.0 207 20.5 41.6 6.3 6.0 2 21.9 33.8 5.6 5.9 8.0 6.1 7.0 28.5 36.0 6.7 5.4 19.3 32.1 31.0 31.1 6.4 25.1 39.4 22.8 40.2 5.0 6.8 4.7 33.1 6.9 39.6 27.0 43.8 23.6 34.3 5.4 5.0 5.6 5.0 5.1 5.1 4.2 5.2 5.3 5.1 23.6 26.3 26.3 32.6 29.2 26.4 27.9 33.0 5.2 4.8 38.6 26.5 34.4 23.7 28.4 34.0 35.2 24.7 27.0 35.0 34.4 23.3 35.6 31.8 27.0 5.0 32.8 4.9 31.0 4.7 27.0 5.5 41.2 4.7 25.5 30.9 27.9 26.5 5.0 4.9 27.8 5.3 23.0 4.6 26.4
Step by Step Solution
3.33 Rating (159 Votes )
There are 3 Steps involved in it
There are many different ways to test for normality but some common ... View full answer

Get step-by-step solutions from verified subject matter experts