

Question: The normal quantile plot represents weights (in pounds) of diet Coke from Data Set 17 in Appendix B. Examine the normal quantile plot and determine
The normal quantile plot represents weights (in pounds) of diet Coke from Data Set 17 in Appendix B.
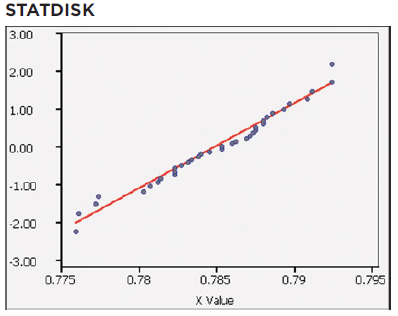
Examine the normal quantile plot and determine whether it depicts sample data from a population with a normal distribution.
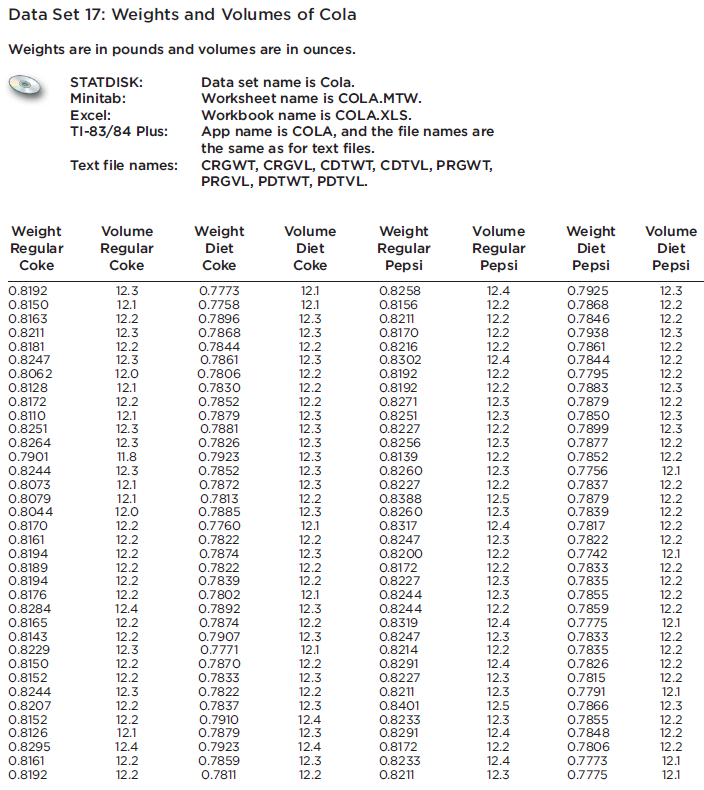
Data Set 17: Weights and Volumes of Cola Weights are in pounds and volumes are in ounces. STATDISK: Data set name is Cola. Minitab: Worksheet name is COLA.MTW. Excel: Workbook name is COLA.XLS. TI-83/84 Plus: App name is COLA, and the file names are the same as for text files. Text file names: CRGWT, CRGVL, CDTWT, CDTVL, PRGWT, PRGVL, PDTWT, PDTVL. Weight Regular Coke Weight Diet Volume Weight Diet Volume Weight Regular Pepsi Volume Volume Regular Coke Diet Regular Pepsi Diet Coke Coke Pepsi Pepsi 0.8192 12.3 0.7773 12.1 0.8258 12.4 0.7925 12.3 0.8150 12.1 0.7758 12.1 0.8156 12.2 0.7868 12.2 12.2 12.3 12.2 12.2 0.8163 0.8211 12.2 0.7896 12.3 0.8211 12.2 0.7846 0.7938 12.3 0.7868 12.3 12.2 0.8170 0.8216 0.8302 12.2 0.8181 0.8247 12.2 12.3 0.7844 12.2 12.4 0.7861 0.7844 0.7861 0.7806 0.7830 0.7852 0.7879 0.7881 0.8062 0.8128 12.3 12.2 12.2 12.0 0.8192 12.2 12.2 12.3 0.7795 0.7883 0.7879 12.2 12.1 0.8192 12.3 0.8172 12.2 12.2 0.8271 0.8251 0.8227 12.2 0.8110 0.8251 12.1 12.3 12.3 12.3 12.3 12.3 12.3 12.3 0.7850 0.7899 12.3 12.3 12.2 12.3 0.8264 12.3 0.7826 0.8256 0.8139 0.7877 12.2 0.7901 11.8 12.3 12.1 0.7923 12.2 0.7852 12.2 0.8244 0.7852 0.8260 0.8227 12.3 0.7756 12.1 0.7872 12.2 0.8073 0.8079 0.8044 12.3 12.2 12.3 12.1 12.2 0.7837 12.1 12.0 12.2 12.2 12.2 0.7813 0.7885 0.7760 0.7822 0.8388 0.8260 0.8317 12.5 12.3 12.4 0.7879 12.2 12.2 0.7839 0.7817 0.7822 0.8170 12.2 0.8247 0.8200 0.8172 0.8227 0.8161 12.2 12.3 12.2 0.8194 0.7874 12.3 12.2 12.2 12.1 12.2 12.2 0.7742 12.1 0.8189 0.8194 0.8176 0.8284 0.8165 0.8143 12.2 0.7822 0.7833 0.7835 0.7855 0.7859 0.7775 12.2 12.2 12.2 0.7839 0.7802 12.3 12.3 12.2 0.8244 12.2 12.4 0.7892 12.3 0.8244 12.2 12.2 12.2 0.7874 12.2 0.8319 12.4 12.1 12.2 12.2 12.2 0.8229 0.8150 12.3 12.2 0.7907 0.7771 12.3 12.1 0.8247 0.8214 12.3 12.2 12.4 0.7833 0.7835 0.7826 0.7870 12.2 0.8291 12.2 12.2 12.3 12.2 0.8227 0.8211 0.7815 0.7791 0.7866 0.7855 0.7848 0.7806 0.7773 0.7775 0.8152 0.7833 12.3 12.2 12.3 12.4 12.3 12.2 0.7822 0.7837 0.7910 0.7879 0.8244 0.8207 12.3 12.1 12.5 12.3 12.4 0.8401 12.3 0.8152 0.8126 12.2 12.1 0.8233 0.8291 12.2 12.2 12.3 12.4 0.8172 0.8233 0.8211 0.8295 12.4 0.7923 12.2 12.2 0.8161 12.2 0.7859 12.3 12.2 12.4 12.1 0.8192 12.2 0.7811 12.3 12.1
Step by Step Solution
3.31 Rating (157 Votes )
There are 3 Steps involved in it
ANSWER Based on the normal quantile plot we can conclude that the sample data does not come fro... View full answer

Get step-by-step solutions from verified subject matter experts