

The following graph shows the relationship between three variables: number of licensed drivers, number of registered vehicles,
Question:
The following graph shows the relationship between three variables: number of licensed drivers, number of registered vehicles, and the size of the resident population for the United States from 1961 to 2003. Study the graph and answer these questions:
a. Does it seem reasonable that the Population line and the Drivers line run basically parallel to each other and that the Population line is above the Drivers line? Explain what it means for them to be parallel. What would it mean if they were not parallel?
b. The Drivers and Motor Vehicles lines cross.
What does this mean? When do the lines intersect, and what does the point of intersection represent?
c. Explain the relationship between motor vehicles and drivers before 1973.
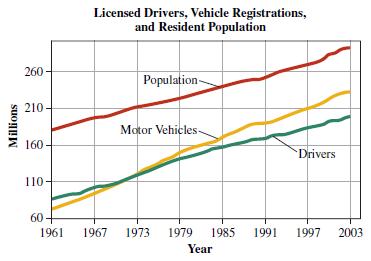
d. Explain the relationship between motor vehicles and drivers after 1973.
e. Do you predict drivers will ever surpass motor vehicles after 2003? Why or why not?
f. Using the years 1982 and 2000, estimate the slopes of the Motor Vehicles line and the Drivers line. Compare and contrast the slopes found.
Step by Step Answer:

This question has not been answered yet.
You can Ask your question!


Just The Essentials Of Elementary Statistics
ISBN: 9780495314875
10th Edition
Authors: Robert Johnson, Patricia Kuby
