

Question: 1. A company created a cohort analysis for its customers during the year. The company defined cohorts based on the month of initial purchase. Thus,
1. A company created a cohort analysis for its customers during the year. The company defined cohorts based on the month of initial purchase. Thus, there are 12 cohorts. The exhibit below shows the repurchase rates for each cohort during the year by month.
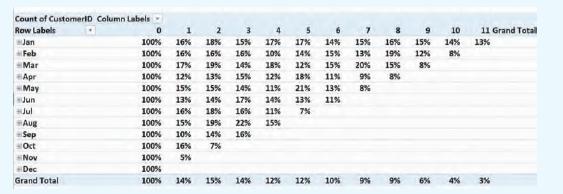
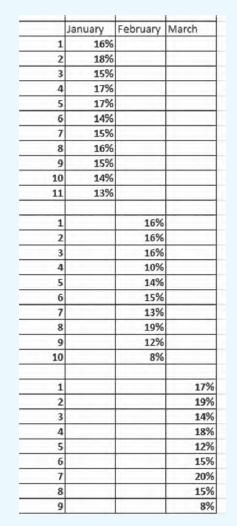
Suppose the company wants to easily see the trends in the data. Specifically, the company wants to answer the question “How do repurchase rate trends differ between the January, February, and March cohorts?” Sometimes it is easier to see trends in the data via a data visualization instead of a chart. For example, a cycle plot shows trends in data. Let’s create a cycle plot for the first three cohorts (January, February, and March). The side-by-side nature of a cycle plot should help us see how the three cohort patterns/trends differ. To create the cycle plot, follow these steps:
1. Type the following data into Excel using the exact same format. To make the cycle plot work in Excel, the February cohort data need to start in a new column after the January data, and the March cohort data need to start in a new column after the February cohort data. In other words, the columns must be offset, as shown in the following exhibit, to make the cycle plot work in Excel.
2. Highlight the data.
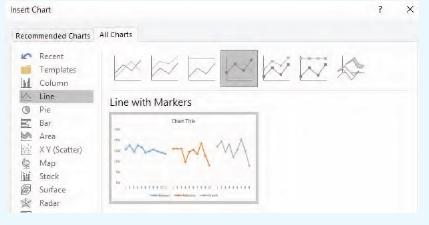
3. From the menu, select Insert > Charts > Recommended Charts.
4. Select All Charts > Line.
5. Select the Line with Markers, which is the fourth chart from the left, as shown below:
Count of CustomerID Column Labels Row Labels 0 1 2 3 4 5 8 9 10 11 Grand Totall Jan 100% 16% 18% 15% 17% 17% 14% 15% 16% 15% 14% 13% Feb 100% 16% 16% 16% 10% 14% 15% 13% 19% 12% 8% Mar 100% 17% 19% 14% 18% 12% 15% 20% 15% 8% #Apr 100% 12% 13% 15% 12% 18% 11% 9% 8% May 100% 15% 15% 14% 11% 21% 13% 8% Jun 100% 13% 14% 17% 14% 13% 11% Jul 100% 16% 18% 16% 11% 7% Aug 100% 15% 19% 22% 15% -Sep 100% 10% 14% 16% Oct 100% 16% 7% Nov 100% 5% Dec 100% Grand Total 100% 14% 15% 14% 12% 12% 10% 9% 9% 6% 3%
Step by Step Solution
There are 3 Steps involved in it

Get step-by-step solutions from verified subject matter experts