

Question: 2. (LO 3.3, 3.6) Consider the following table. a. How is this IQ classification consistent with the z-score and confidence interval if the average population
2. (LO 3.3, 3.6) Consider the following table.
a. How is this IQ classification consistent with the z-score and confidence interval if the average population IQ is 100 and the standard deviation is 15?
b. If your IQ is 130, the average population IQ is 100, and the standard deviation is 15, what is your z-score? How many standard deviations is that z-score above the mean?
What does that suggest about your IQ compared to the population?
c. If the average IQ of the population is 100 and the standard deviation is 15, what is the 95 percent confidence interval?
d. How would you evaluate an IQ score of 65 using either a z-score or confidence interval?
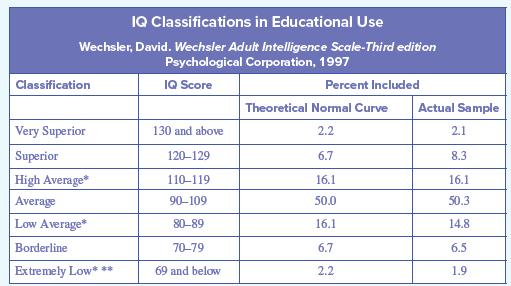
IQ Classifications in Educational Use Wechsler, David. Wechsler Adult Intelligence Scale-Third edition Psychological Corporation, 1997 Classification IQ Score Percent Included Theoretical Normal Curve Actual Sample Very Superior 130 and above 2.2 2.1 Superior 120-129 6.7 8.3 High Average* 110-119 16.1 16.1 Average 90-109 50.0 50.3 Low Average* 80-89 16.1 14.8 Borderline 70-79 6.7 6.5 Extremely Low*** 69 and below 2.2 1.9
Step by Step Solution
There are 3 Steps involved in it

Get step-by-step solutions from verified subject matter experts