

Consider the following price demand data for a given product: a) Depict the price demand relationship in
Question:
Consider the following price– demand data for a given product:
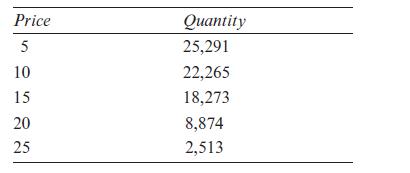
a) Depict the price– demand relationship in a scatter plot.
b) Estimate a linear price– response function using the INTERCEPT and SLOPE functions in Excel.
c) Illustrate the estimated price– response function together with the scatter plot.
d) How would you assess the fit of the linear price– response function to these data?
Step by Step Answer:

This question has not been answered yet.
You can Ask your question!
Related Book For 

Question Posted:
