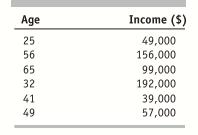
Normalize the data in Table 2.7, showing calculations. Age Income ($) 25 49,000 56 156,000 65 99,000
Question:
Normalize the data in Table 2.7, showing calculations.

Transcribed Image Text:
Age Income ($) 25 49,000 56 156,000 65 99,000 32 192,000 41 49 39,000 57,000
Fantastic news! We've Found the answer you've been seeking!
Step by Step Answer:
Answer rating: 33% (3 reviews)

Answered By

JAPHETH KOGEI
Hi there. I'm here to assist you to score the highest marks on your assignments and homework. My areas of specialisation are:
Auditing, Financial Accounting, Macroeconomics, Monetary-economics, Business-administration, Advanced-accounting, Corporate Finance, Professional-accounting-ethics, Corporate governance, Financial-risk-analysis, Financial-budgeting, Corporate-social-responsibility, Statistics, Business management, logic, Critical thinking,
So, I look forward to helping you solve your academic problem.
I enjoy teaching and tutoring university and high school students. During my free time, I also read books on motivation, leadership, comedy, emotional intelligence, critical thinking, nature, human nature, innovation, persuasion, performance, negotiations, goals, power, time management, wealth, debates, sales, and finance. Additionally, I am a panellist on an FM radio program on Sunday mornings where we discuss current affairs.
I travel three times a year either to the USA, Europe and around Africa.
As a university student in the USA, I enjoyed interacting with people from different cultures and ethnic groups. Together with friends, we travelled widely in the USA and in Europe (UK, France, Denmark, Germany, Turkey, etc).
So, I look forward to tutoring you. I believe that it will be exciting to meet them.
3.00+
2+ Reviews
10+ Question Solved
Related Book For 

Data Mining For Business Analytics Concepts Techniques And Applications With Jmp Pro
ISBN: 9781118877432
1st Edition
Authors: Galit Shmueli, Peter C Bruce, Mia L Stephens, Nitin R Patel
Question Posted:
Students also viewed these Business questions
-
Calibrate the rotameter with the ball at the settings designated by the instructor. Take readings at the center of the ball. To calibrate, take three soap bubble meter readings at each rotameter...
-
SA-TIED YOUNG SCHOLARS PROGRAMME Young Scholars This paper was produced as a part of the SA-TIED Young Scholars' programme. The programme is a part of SATIED's capacity building initiatives, designed...
-
The data in Table P-14 are weekly automobile accident counts for the years 2006 and 2007 in Havana County. Determine the appropriate ARIMA model, and forecast accidents for the 91st week. Comment on...
-
Describe Robertson Tool's business risk, making critical judgments. Consider the volatility of its revenues and operating expenses, therefore appraising the volatility of its EBIT. HINT: Consider the...
-
How would you decide whether to transfer risk or share risk?
-
What is the purpose of a combining workpaper pre- pared by a trustee? LO4
-
The function is a standing wave solution analogous to eq. (31.10) for a surface gravity in an ocean of depth h. Following the derivation in the text, construct the kinetic and potential energy per...
-
The administrators of Tiny College are so pleased with your design and implementation of their student registration/tracking system that they want you to expand the design to include the database for...
-
Leonardo, who is married but files separately, eams $81,400 of taxable income. He also has $18,000 in city of Tulsa bonds. His wife, Theresa, earns $53,000 of taxable income if Leonardo Instead had...
-
Two models are applied to a dataset that has been partitioned. Model A is considerably more accurate than model B on the training data, but slightly less accurate than model B on the validation data....
-
A dataset has 1000 records and 50 attributes with 5% of the values missing, spread randomly throughout the records and attributes. An analyst decides to remove records with missing values. About how...
-
Ford Motor Company advertises its cars on radio and on television. The company is interested in assessing the probability that a randomly chosen person is exposed to at least one of these two modes...
-
You have two dashboards in the same workspace named Production and Manufacturing. Your company's Power BI administrator creates the following two dashboard data classifications: Medium Impact (MEDI)...
-
Question 2: Red Rocks Corporation was organized on September 1. Red Rocks encountered the following events during the first month of operations. a. Received $65,000 cash from the investors who...
-
he previous three weeks of data is below for the sales of sheds at SHEDS INC. Calculate the forecast for the next perioud (week 4) using a two period weighted moving average using weights of 3 and 2....
-
/3 3) ST tan(x) - In(cosx) dx What is the value of u? us dulcis) What is the corresponding value of du? du= 1-5mx dx cosx You must show all of your work in the space below to earn full credit. 9/3 So...
-
Please use the file which provides the data to answer the problems 1-3. Problem 1) The time Students entered the classroom of OM 390, Introductory Operations Management, was recorded by the professor...
-
The mean of a population of raw scores is 50 (x = 18). (a) Using the z-table, what is the relative frequency of sample means below 46 when N = 40? (b) What is the probability of randomly selecting a...
-
Suppose you need to answer any four of seven essay questions on a history test and you can answer them in any order. a. How many different question combinations are possible? b. What is the...
-
Production numbers for 2 shifts are shown. The shift supervisor of Shift 2 insists to the production manager that her operators are more productive than the ones on Shift 1. Using a confidence level...
-
In a class, the scores that students got are as shown. What are the 25, 50, 75 and 100th percentiles for the data? 84 84 98 80 89 83 85 56 85 84 84 74 84 81 83 80 45 86 67 79 81 78 76 85 83 77 86 83...
-
Number of points made by Teams A and B are shown. Which statement is true based on running the F-Test Two-Sample for Variances in the Data Analysis pack in Excel? Use a confidence level of 10% to...

Study smarter with the SolutionInn App


