Use the test scores in Exercise 1.8 two make two histograms, one using the first-grade scores and
Question:
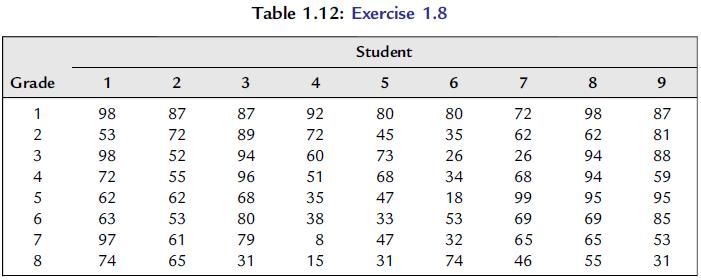
Use the test scores in Exercise 1.8 two make two histograms, one using the first-grade scores and the other the eighth-grade scores. In each case, use the intervals 0–9, 10–19,…, 90–99. Summarize the main differences between these two histograms.
Exercise 1.8
Table 1.12 lists the reading comprehension scores for nine students at a small private school known for its academic excellence. Twenty students were admitted to the kindergarten class, and the nine students in the table stayed at the school through eighth grade. The scores are percentiles relative to students at suburban public schools; for example, Student 1 scored in the 98th percentile in first grade and in the 53rd percentile in second grade. Identify the following data as cross-section, time series, or panel data:
a. Student 4’s scores in grades 1 through 8.
b. The nine students’ eighth grade scores.
c. The nine students’ scores in first grade and eighth grade.
d. The nine students’ scores in first grade through eighth grade.
Step by Step Answer:

Essential Statistics Regression And Econometrics
ISBN: 9780123822215
1st Edition
Authors: Gary Smith


