

11. The following table presen ts ten years of return data for the stock of Glenwood City...
Question:
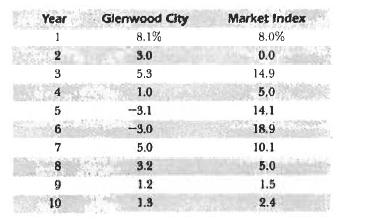
11. The following table presen ts ten years of return data for the stock of Glenwood City Properties and for a market index. Plot the returns of Glenwood City and the market index on a graph. with the market index's returns on the horizontal axis and Glenwood City's returns on the vertical axis. Draw your best guess of the market model through these points. Examining the graph, estimate the beta of Glenwood City stock.
Step by Step Answer:

This question has not been answered yet.
You can Ask your question!
Related Book For 
Investments
ISBN: 9788120321014
6th Edition
Authors: William F. Sharpe, Gordon J. Alexander, Jeffery V. Bailey
Question Posted:
