

Question: The following table is based on data reported in Light-to-Moderate Alcohol Consumption and Risk of Stroke Among U.S. Male Physicians (New England Journal of Medicine
The following table is based on data reported in “Light-to-Moderate Alcohol Consumption and Risk of Stroke Among U.S. Male Physicians” (New England Journal of Medicine [1999]: 1557–1564). The table is based on 21,870 male physicians age 40–84 who are participating in the Physician’s Health Study.
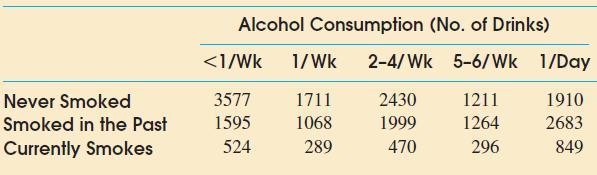
a. Calculate row percentages by dividing each observed count by the corresponding row total. Are the proportions falling in each of the alcohol consumption categories similar for the three smoking categories?
b. Test the hypothesis that smoking status and alcohol consumption are independent.
c. Is the result of your test in Part (b) consistent with what you expected based on your answer to Part (a)? If not, explain why your initial impression based on the percentages may not have been accurate. What aspect of the data set factors into your explanation?
Never Smoked Smoked in the Past Currently Smokes Alcohol Consumption (No. of Drinks)
Step by Step Solution
3.44 Rating (167 Votes )
There are 3 Steps involved in it
To answer these questions well first create a table of row percentages based on the provided data Then well perform a chisquare test to test the indep... View full answer

Get step-by-step solutions from verified subject matter experts