Question:
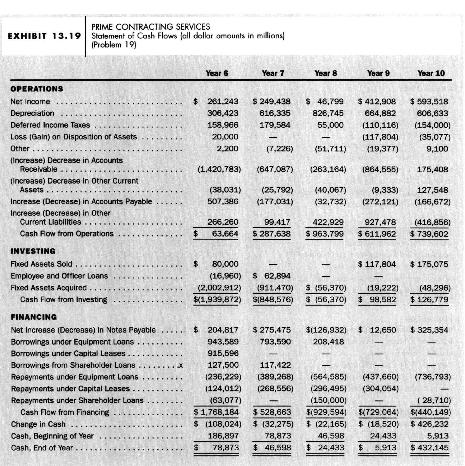
Interpreting the statement of cash flows. Prime Contracting Services provides various services to government agencies under multi-year contracts. In Year 6, the services primarily involved transportation services of equipment and household furniture. Beginning in Year 7, the firm began exiting these transportation services businesses and began offering more people-based services (clerical, training). Sales increased at a compounded annual rate of 28.9 percent during the five-year period. Exhibit 13.19 presents a statement of cash flows for Prime Contracting Services for Year 6 to Year 10. Changes in Other Current Liabilities primarily represent salaries.

a. What evidence do you see of the strategic shift from asset-based to people-based services?
b. What are the likely reasons that net income decreased between Year 6 and Year 8 while cash flow from operations increased during the same period?
c. What are the likely reasons that net income increased between Year 8 and Year 10 while cash flow from operations was less during Year 9 and Year 10 than in Year 8?
d. How has the risk of Prime Contracting Services changed during the five years?

Transcribed Image Text:
EXHIBIT 13.19 OPERATIONS Net Income Depreciation PRIME CONTRACTING SERVICES Statement of Cash Flows fall dollar amounts in milions Problem 19) Deferred Income Taxes Loss (Gain) or Disposition of Assets Other . (Increase) Decrease in Accounts Receivable. (increase) Decrease In Other Current Assets... Increase (Decrease) in Accounts Payable Year 6 Year 7 Year 8 Year 9 Year 10 $ 281.243 306,423 $ 249,438 816,335 158,966 179,584 $ 46,799 826,745 55,000 664,882 $ 412,908 $ 593,518 606,633 (110,116) (154,000) 20,000 (117,804) (35,077) 2,200 (7,226) (51,711) (19,377) 9,100 (1.420,783) (647,087) (263,164) 1864,555) 175,408 (38,031) (25,792) (40,067) 507,386 (177,031) (32,732) (9,333) 127,548 (272,121) (166,672) 266,260 99.417 $ 63.664 $287,638 422,929 $ 963.799 927,478 $611.962 (416,856) $ 739,602 Increase (Decrease) in Other Current Liabilities... Cash Row from Operations INVESTING Fixed Assets Sold. Employee and Officer Loans Fixed Assets Acquired... Cash Flow from Investing FINANCING 80,000 (2,002,912) $1,939,872) (16,960) $ 62,894 (911,470) S1848,576) Net Increase (Decrease) In Notes Payable..... $ 204,817 $275,475 Borrowings under Equipment Loans. Borrowings under Capital Leases. 943,589 915,596 793,590 Borrowings from Shareholder Loans..... 127,500 117,122 $117,804 $175,075 S (56,370) $156,370) $ 98,582 (19,222) (48,296) $126,779 $126,932) $ 12,650 $325,354 208,418 Repayments under Equipment Loans Repayments under Capital Leases.. Repayments under Shareholder Loans Cash Flow from Financing... Change in Cash Cash, Beginning of Year Cash, End of Year. 1236,229) (389,268) (564,585) (437,660) (736,793) $1,768,184 $528,663 (124,012) (268,556) (63,077) (296,495) (304,064) (150,000) (28,710) (929,594 $(22,165) 78,873 46,598 $729.064) $ (18,520) 24,433 $440.149) $ 426,232 $ 78,873 $ 46,598 $ 24,433 $ 5,913 5.913 $432,145 $ (108,024) $ (32,275) 186,897


