

The table shows experimental values of the variables x and y. a. Draw the graph of xy
Question:
The table shows experimental values of the variables x and y.
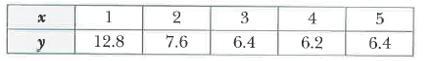
a. Draw the graph of xy against x2.
b. Use your graph to express y in terms of x.
c. Find the value of x and the value of y for which xy = 12.288.
Fantastic news! We've Found the answer you've been seeking!
Step by Step Answer:
Please note that this approach assumes a linear ...View the full answer

Answered By
Benish Ahmad
I'm a professional software engineer. I'm lectutrer at GCUF and I have 3 years of teaching experience. I'm looking forward to getting mostly computer science work including:
Programming fundamentals
Object oriented programming
Data structures
object oriented design and analysis
Database system
Computer networks
Discrete mathematics
Web application
I am expert in different computer languages such as C++, java, JavaScript, Sql, CSS, Python and C#. I'm also have excellent knowledge of essay writing and research. I have worked in other Freelancing website such as Fiverr and Upwork. Now I have finally decided to join the SolutionInn platform to continue with my explicit work of helping dear clients and students to achieve their academic dreams. I deliver plagiarism free work and exceptional projects on time. I am capable of working under high pressure.
2+ Reviews
10+ Question Solved
Related Book For 

Cambridge IGCSE And O Level Additional Mathematics Coursebook
ISBN: 9781108411660
2nd Edition
Authors: Sue Pemberton
Question Posted:
