In a classic study, Beaver (1968) examined the trading volume of firms' securities around the time of
Question:
In a classic study, Beaver (1968) examined the trading volume of firms' securities around the time of their earnings announcements. Specifically, he examined 506 annual earnings announcements of 143 NYSE firms over the years 1961-1965 inclusive (261 weeks).
For each earnings announcement, Beaver calculated the average daily trading volume (of the shares of the firm making that announcement) for each week of a 17-week win- dow surrounding week 0 (the week in which the earnings announcement was made). For each firm in the sample, he also calculated the average daily trading volume outside its 17-week window. This was taken as the normal trading volume for that firm's shares.
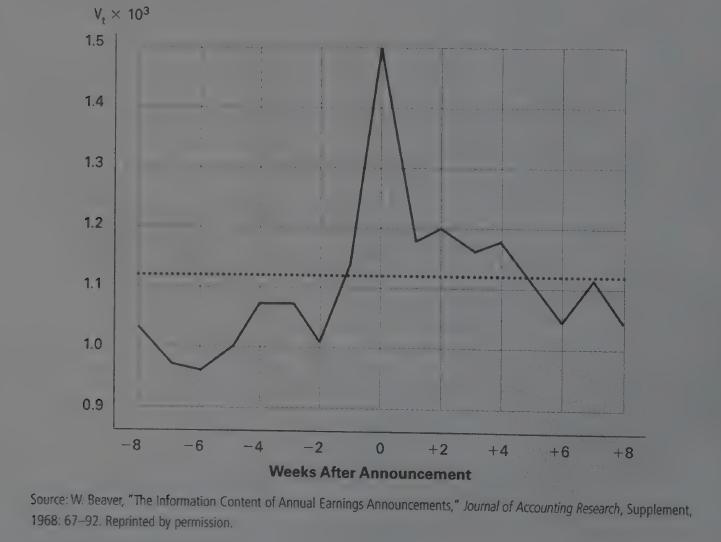
For each week in the 17-week window, Beaver averaged the trading volumes over the 506 earnings announcements in the sample. The results are shown in Figure 5.4 below. The dotted line in the figure shows the average normal trading volume outside the 17-week window. As can be seen from the figure, there was a dramatic increase in trading volume, relative to normal, in week0.
Also, volume is below normal during most of the weeks leading up to week0.
Figure 5.4 Volume Analysis
Required
a. Why do you think trading volume increased in week 0?
b. Why do you think trading volume was below normal in the weeks leading up to week 0?
c. Do Beaver's volume results support the decision usefulness of earnings information? Explain.
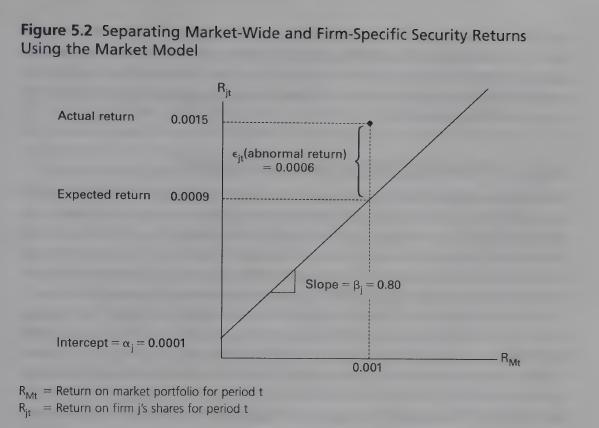
d. Which is the better indicator of decision usefulness, the abnormal return measure (Figure 5.2) or the volume measure? Explain
Step by Step Answer: