Question:
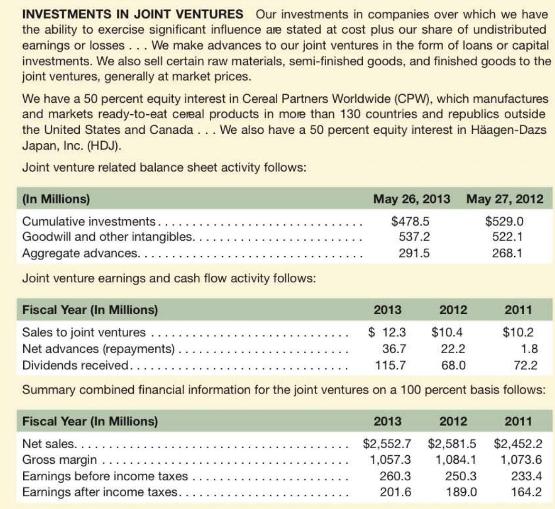
General Mills, Inc. invests in a number of joint ventures to manufacture and distribute its food products as discussed in the following footnote to its fiscal year 2013 10-K report:

Required
a. How does General Mills account for its investments in joint ventures? How are these investments reflected on General Mills' balance sheet, and how, generally, is income recognized on these investments?
b. Does the \(\$ 187.0\) million investment reported on General Mills' balance sheet sufficiently reflect the assets and liabilities required to conduct these operations? Explain.
c. Do you believe that the liabilities of these joint venture entities represent actual obligations of General Mills? Explain.
d. What potential problem(s) does equity method accounting present for analysis purposes?
Transcribed Image Text:
INVESTMENTS IN JOINT VENTURES Our investments in companies over which we have the ability to exercise significant influence are stated at cost plus our share of undistributed eamings or losses... We make advances to our joint ventures in the form of loans or capital investments. We also sell certain raw materials, semi-finished goods, and finished goods to the joint ventures, generally at market prices. We have a 50 percent equity interest in Cereal Partners Worldwide (CPW), which manufactures and markets ready-to-eat cereal products in more than 130 countries and republics outside the United States and Canada... We also have a 50 percent equity interest in Hagen-Dazs Japan, Inc. (HDJ). Joint venture related balance sheet activity follows: (in Millions) Cumulative investments..... Goodwill and other intangibles. Aggregate advances.... Joint venture earnings and cash flow activity follows: May 26, 2013 May 27, 2012 $478.5 $529.0 537.2 522.1 291.5 268.1 Fiscal Year (In Millions) 2013 2011 Sales to joint ventures .... $ 12.3 $10.4 $10.2 36.7 22.2 1.8 Net advances (repayments). Dividends received..... 115.7 68.0 72.2 Summary combined financial information for the joint ventures on a 100 percent basis follows: Fiscal Year (in Millions) Net sales.... Gross margin. Earnings before income taxes. Earnings after income taxes.. 2012 2013 2012 $2,552.7 $2,581.5 1,057.3 1,084.1 260.3 250.3 201.6 189.0 2011 $2,452.2 1,073.6 233.4 164.2


