Question:
Use the Internet search engine of your choice and do a general search on the name of a company of interest to you (e.g., General Motors, Procter & Gamble, Coca-Cola, etc.). Explore the website of the company you choose and locate that company’s most recent financial statements. You may need to look under a category that provides general information about the company and/or investor information.
Instructions
a. Find and read the description of the company, including the type of business it is. Why is gaining an understanding of the industry and type of business an important starting point for financial statement analysis?
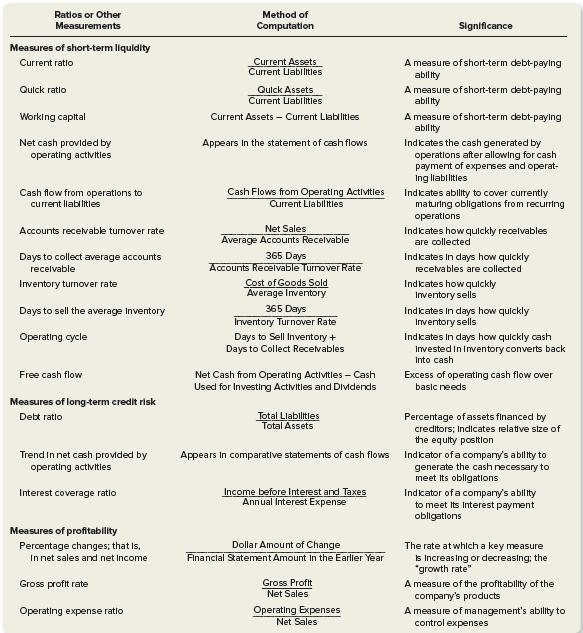
b. Locate the company’s most recent financial statements. Find the summary table of ratios in this chapter in Exhibit 14–26. Calculate three of the listed ratios under each of the following categories: “Measures of short-term liquidity” and “Measures of profitability.” Show your work in calculating these ratios. Write a brief statement describing what you have learned about your company’s liquidity and profitability.

c. Why do you think the Internet has become such a widely used source of financial information by investors and creditors?
Transcribed Image Text:
Ratios or Other
Measurements
Measures of short-term liquidity
Current ratio
Quick ratio
Working capital
Net cash provided by
operating activities
Cash flow from operations to
current liabilitles
Accounts receivable turnover rate
Days to collect average accounts
recelvable
Inventory turnover rate
Days to sell the average Inventory
Operating cycle
Free cash flow
Measures of long-term credit risk
Debt ratlo
Trend In net cash provided by
operating activities
Interest coverage ratio
Measures of profitability
Percentage changes; that is,
In net sales and net Income
Gross profit rate
Operating expense ratio
Method of
Computation
Current Assets
Current Liabilitles
Quick Assets
Current Labilities
Current Assets - Current Liabilities
Appears in the statement of cash flows
Cash Flows from Operating Activities
Current Liabilitles
Net Sales
Average Accounts Receivable
365 Days
Accounts Receivable Turnover Rate
Cost of Goods Sold
Average Inventory
365 Days
Inventory Turnover Rate
Days to Sell Inventory +
Days to Collect Receivables
Net Cash from Operating Activities - Cash
Used for Investing Activities and Dividends
Total Liabilities
Total Assets
Appears in comparative statements of cash flows
Income before Interest and Taxes
Annual Interest Expense
Dollar Amount of Change
Financial Statement Amount in the Earller Year
Gross Profit
Net Sales
Operating Expenses
Net Sales
Significance
A measure of short-term debt-paying
ability
A measure of short-term debt-paying
ability
A measure of short-term debt-paying
ability
Indicates the cash generated by
operations after allowing for cash
payment of expenses and operat-
Ing liabilitles
Indkates ability to cover currently
maturing obligations from recurring
operations
Indicates how quickly receivables
are collected
Indicates In days how quickly
receivables are collected
Indkates how quickly
Inventory sells
Indicates in days how quickly
Inventory sells
Indicates in days how quickly cash
Invested in Inventory converts back
Into cash
Excess of operating cash flow over
basic needs
Percentage of assets financed by
creditors; Indicates relative size of
the equity position
Indicator of a company's ability to
generate the cash necessary to
meet its obligations
Indicator of a company's ability
to meet its interest payment
obligations
The rate at which a key measure
Is Increasing or decreasing; the
"growth rate"
A measure of the profitability of the
company's products
A measure of management's ability to
control expenses


