

Question: On the spreadsheet with this chapter you will find the following monthly data for Cisco?s stock price and the S&P 500 index. Compute the equation
On the spreadsheet with this chapter you will find the following monthly data for Cisco?s stock price and the S&P 500 index. Compute the equation rCSCO, t = ?CSCO + ?CSCO rSP,t and include the R2 and t -statistics for the equation and its coefficients.22
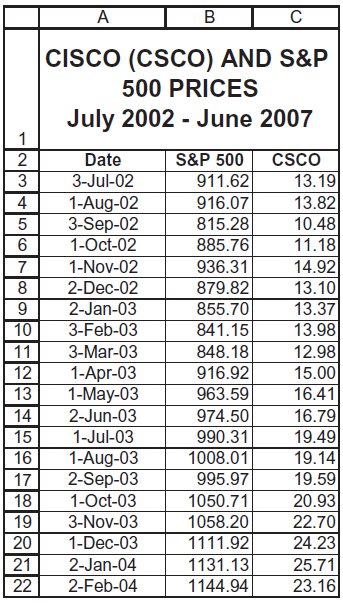
CISCO (CSCO) AND S&P 500 PRICES July 2002 - June 2007 S&P 500 911.62 Date 3-Jul-02 CSCO 13.19 916.07 4 1-Aug-02 3-Sep-02 1-Oct-02 13.82 815.28 10.48 11.18 885.76 1-Nov-02 936.31 14.92 2-Dec-02 879.82 13.10 2-Jan-03 3-Feb-03 3-Mar-03 13.37 855.70 10 841.15 13.98 848.18 11 12.98 916.92 15.00 12 1-p-03 1-May-03 13 963.59 16.41 14 2-Jun-03 974.50 16.79 15 1-Jul-03 990.31 19.49 1-Aug-03 2-Sep-03 19.14 1008.01 16 995.97 19.59 17 20.93 22.70 18 1-Oct-03 1050.71 19 3-Nov-03 1058.20 20 21 1-Dec-03 1111.92 24.23 2-Jan-04 1131.13 25.71 22 2-Feb-04 1144.94 23.16
Step by Step Solution
3.34 Rating (157 Votes )
There are 3 Steps involved in it
We can use the data analysis functionality in excel Go to Data tab of ex... View full answer

Get step-by-step solutions from verified subject matter experts