Question:
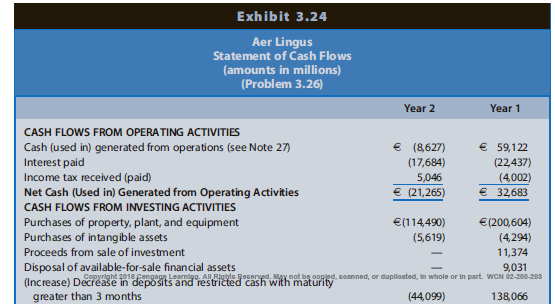
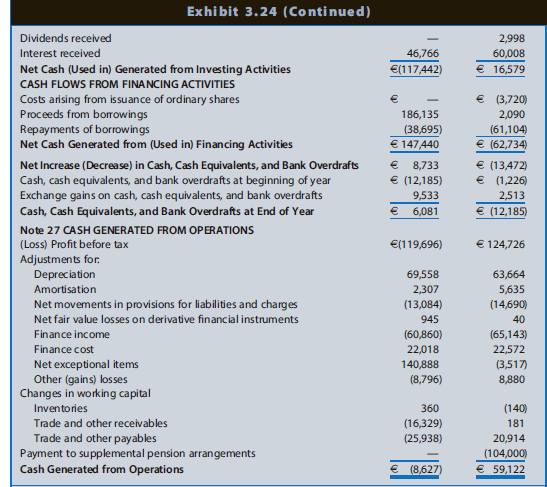
Aer Lingus is an international airline based in Ireland. Exhibit 3.24 provides the statement of cash flows for Year 1 and Year 2, which includes a footnote from the financial statements. Year 2 was characterized by weakening consumer demand for air travel due to a recession and record-high fuel prices. In addition, Year 2 includes exceptional items totaling ˆˆ141 million, which reflect a staff restructuring program for early retirement (ˆˆ118 million), takeover defense costs due to a bid by Ryanair (ˆˆ18 million), and other costs (ˆˆ5 million).
REQUIRED
a. Based on information in the statement of cash flows, compare and contrast the cash flows for Years 1 and 2. Explain significant differences in individual reconciling items and direct cash flows.
b. The format of Aer Lingus€™ statement of cash flows is the direct method, as evidenced by the straightforward titles used in the operating section. How is this statement different from the presentation that Aer Lingus would report using the indirect method?


Transcribed Image Text:
Exhibit 3.23 (Continued) Cash flows provided by (used in) investing activities: Additions to property and equipment Acquisitions, net of cash acquired (115,187) (162,573) (168,177) (73,736) (5,497) 5,000 Maturities of marketable securities 10,000 Proceeds from sale-leaseback, net Proceeds from dispositions, net 169,018 76,434 21,251 Collateralization of letter of credit 126,615 (126,615) Other investing activities Net cash (used in) provided by investing activities Cash flows provided by (used in) financing activities: Payments on borrowings Proceeds from borrowings Apollo Group Class A common stock purchased for treasury (1,694) (114,183) 164,311 (295,289) (562,269) 629,145 (811,913) (437,925) (477,568) 410,051 475,454 (783,168) 24,903 6,875 4,014 (775,250) (446,398) Issuance of Apollo Group Class A common stock Noncontrolling interest contributions Excess tax benefits from share-based compensation 11,949 19,671 2,460 1,150 (731,938) 6,648 Net cash used in financing activities (419,733) Exchange rate effect on cash and cash equivalents Net (decrease) increase in cash and cash equivalents Cash and cash equivalents, beginning of year (468) 712 (1,697) (295,289) 286,895 316,523 1,571,664 1,284,769 968,246 Cash and cash equivalents, end of year $1,276,375 $1,571,664 $1,284,769


