Based on Exhibits 2 and 3 and using Method 1, the amount (in absolute terms) by which
Question:
Based on Exhibits 2 and 3 and using Method 1, the amount (in absolute terms) by which the Hutto-Barkley Inc. corporate bond is mispriced is closest to:
A. 0.3368 per 100 of par value.
B. 0.4682 per 100 of par value.
C. 0.5156 per 100 of par value.
Betty Tatton is a fixed-income analyst with the hedge fund Sailboat Asset Management (SAM). SAM invests in a variety of global fixed-income strategies, including fixed-income arbitrage. Tatton is responsible for pricing individual investments and analyzing market data to assess the opportunity for arbitrage. She uses two methods to value bonds:
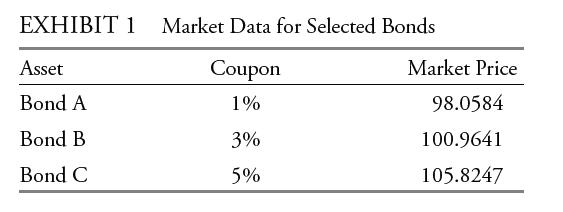
Tatton compiles pricing data for a list of annual pay bonds (Exhibit 1). Each of the bonds will mature in two years, and Tatton considers the bonds risk-free; both the one-year and twoyear benchmark spot rates are 2%. Tatton calculates the arbitrage-free prices and identifies an arbitrage opportunity to recommend to her team.
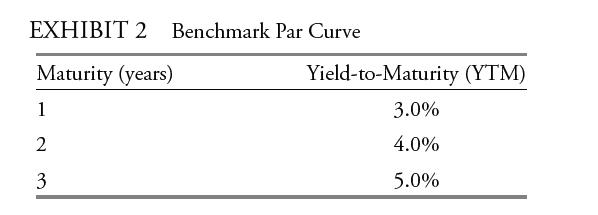
Next, Tatton uses the benchmark yield curve provided in Exhibit 2 to consider arbitrage opportunities of both option-free corporate bonds and corporate bonds with embedded options. The benchmark bonds in Exhibit 2 pay coupons annually, and the bonds are priced at par.
Tatton then identifies three mispriced three-year annual coupon bonds and compiles data on the bonds (see Exhibit 3).
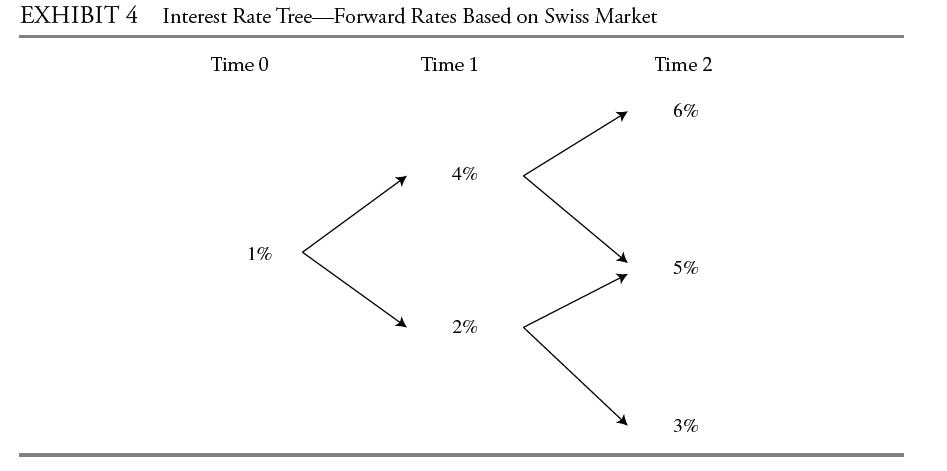
Lastly, Tatton identifies two mispriced Swiss bonds, Bond X, a three-year bond, and Bond Y, a five-year bond. Both are 6% annual coupon bonds. To calculate the bonds’ values, Tatton devises the first three years of the interest rate lognormal tree presented in Exhibit 4 using historical interest rate volatility data. Tatton considers how these data would change if implied volatility, which is higher than historical volatility, were used instead.
Step by Step Answer:


