

9-89. A five-year earnings summary for Kingsmen PLC is presented in the table below. Using the data...
Question:
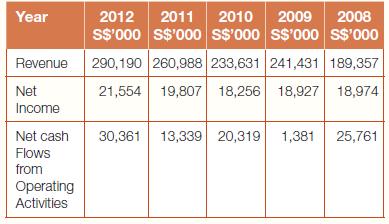
9-89. A five-year earnings summary for Kingsmen PLC is presented in the table below. Using the data provided, construct a single graph of three earnings measures, and then prepare a memo to your professor addressing the following items:
1. What type of graph did you create? Explain.
Include your graph in your memo.
2. Explain whether there appears to be a relationship among the earnings measures you calculated.
3. Assess your chart’s design in terms of presentation bias. If you feel your chart is free from bias, explain why this is so. Then develop a second chart with the data presented which you think might mislead readers.
4. Go to the web site: www.kingsmen.com. What does this company do?
5. Explore potential competitors.
6. Compare ratios you calculated with a similar company and explain the similarities and differences.
Step by Step Answer:

This question has not been answered yet.
You can Ask your question!


Forensic Accounting
ISBN: 9781292059372
1st Global Edition
Authors: Robert J. Rufus, Bill Hahn, Laura Savory Miller, William Hahn
