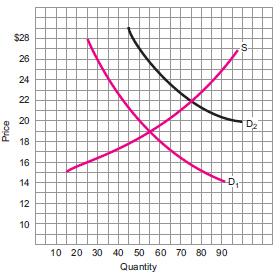
a) In Figure 6 , if the demand curve is D 1 , how much are equilibrium
Question:
a) In Figure 6 , if the demand curve is D 1 , how much are equilibrium price and quantity?
b) If demand changes from D 1 to D 2 , does that represent an increase or decrease in demand?
c) How much are the new equilibrium price and quantity? ( LO3 , 4 )

Fantastic news! We've Found the answer you've been seeking!
Step by Step Answer:
Related Book For 

Question Posted:


