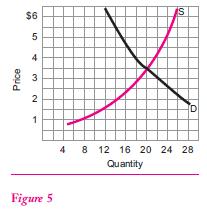
Draw in a new supply curve, S 1 , on Figure 5 , showing a decrease in
Question:
Draw in a new supply curve, S 1 , on Figure 5 , showing a decrease in supply. What happens to equilibrium price and quantity? ( LO4 )

Fantastic news! We've Found the answer you've been seeking!
Step by Step Answer:
Related Book For 

Question Posted:


