

30. Yield Curve. In Figure 6-7, we saw a plot of the yield curve on stripped Treasury...
Question:
30. Yield Curve. In Figure 6-7, we saw a plot of the yield curve on stripped Treasury bonds and pointed out that bonds of different maturities may sell at different yields to maturity. In prin- ciple, when we are valuing a stream of cash flows, each cash flow should be discounted by the yield appropriate to its particular maturity. Suppose the yield curve on (zero-coupon) Treasury strips is as follows:
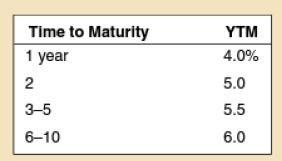 You wish to value a 10-year bond with a coupon rate of 10%, paid annually. (LO2)
a. Set up an Excel spreadsheet to value each of the bond's annual cash flows using this table of yields. Add up the present values of the bond's 10 cash flows to obtain the bond price.
b. What is the bond's yield to maturity?
c. Compare the yield to maturity of the 10-year, 10% coupon bond to that of a 10-year zero- coupon bond or Treasury strip. Which is higher? Why does this result make sense given this yield curve?
Step by Step Answer:

This question has not been answered yet.
You can Ask your question!


Fundamentals Of Corporate Finance
ISBN: 9780073382302
6th Edition
Authors: Richard A Brealey, Stewart C Myers, Alan J Marcus
