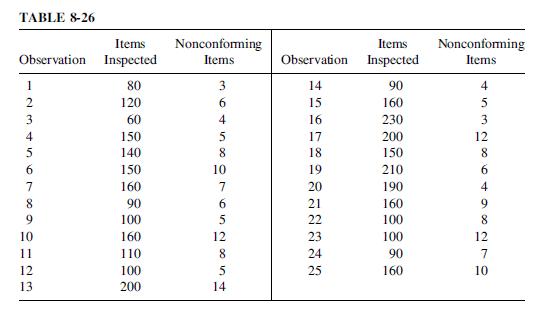
Observations are taken from the output of a company making semiconductors. Table 8-26 shows the sample size
Question:
Observations are taken from the output of a company making semiconductors.
Table 8-26 shows the sample size and the number of nonconforming semiconductors for each sample. Construct a p-chart by setting up the exact control limits for each sample. Are any samples out of control? If so, assuming special causes, revise the centerline and control limits.
Fantastic news! We've Found the answer you've been seeking!
Step by Step Answer:
Related Book For 

Fundamentals Of Quality Control And Improvement
ISBN: 9781119692331
5th Edition
Authors: Amitava Mitra
Question Posted:


