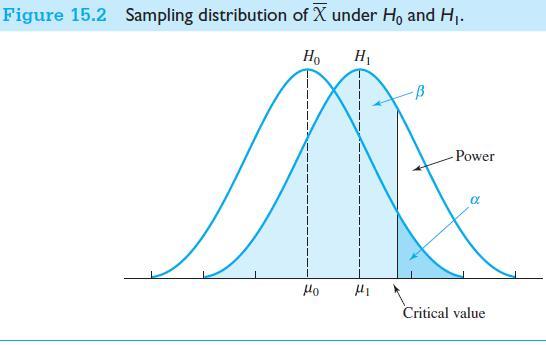
Diagram the situation described in Exercise 15.6 along the lines of Figure 15.2. E xercise 15.6 Following
Question:
Diagram the situation described in Exercise 15.6 along the lines of Figure 15.2.
Exercise 15.6
Following on from Exercise 15.3, suppose that my colleagues were tired of having children tell them what they think we want to hear and gave them a heart-to-heart talk on the necessity of accurate reporting. Suppose that this reduced their population mean Lie score from 4.39 to 2.75, again with a standard deviation of 2.61. If we have 36 children for this analysis, what is the power of finding significantly fewer distortions in these children’s reports than in the general population? The population of normal children still has a population mean of 3.87.
Exercise 15.3
In Section 12.3 we looked at a set of data on whether children who are stressed from their parents’
divorce tend to tell us what they think we want to hear, rather than what they really feel.
For those data the test on H0 was not significant, even though the sample size was 36. Suppose that the experimenters had, in fact, actually estimated the mean and standard deviation of the population of stressed children exactly.
a) What is the effect size in question?
b) What is the value of δ for a sample size of 36?
c) What is the power of the test?
Step by Step Answer:

Fundamental Statistics For The Behavioral Sciences
ISBN: 9781305652972
9th Edition
Authors: David C. Howell


