

Draw a dot plot of the televisions per household data from Problem 25. A researcher with A. C. Nielsen wanted to determine the number of
Draw a dot plot of the televisions per household data from Problem 25.
A researcher with A. C. Nielsen wanted to determine the number of televisions in households. He conducts a survey of 40 randomly selected households and obtains the following data.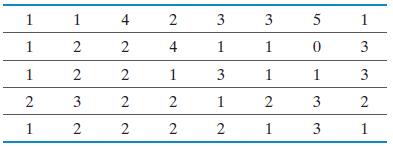
1 1 1 2 1 1 2 2 3 2 4 2 2 2 2 2 4 1 2 2 3 1 3 1 2 3 1 1 2 1 5 0 1 3 3 1 3 3 2 1
Step by Step Solution
3.42 Rating (165 Votes )
There are 3 Steps involved in it
Step: 1
Television... View full answer

Get step-by-step solutions from verified subject matter experts
100% Satisfaction Guaranteed-or Get a Refund!
Step: 2Unlock detailed examples and clear explanations to master concepts

Step: 3Unlock to practice, ask and learn with real-world examples
See step-by-step solutions with expert insights and AI powered tools for academic success
-
 Access 30 Million+ textbook solutions.
-
Ask unlimited questions from AI Tutors.
-
Order free textbooks.
-
100% Satisfaction Guaranteed-or Get a Refund!
Claim Your Hoodie Now!

Authors: Michael Sullivan III
6th Edition
0136807348, 9780136807346

Study Smart with AI Flashcards
Access a vast library of flashcards, create your own, and experience a game-changing transformation in how you learn and retain knowledge
Explore Flashcards

