

For each of the following situations, create a scatterplot of the data and describe the nature, direction,
Question:
For each of the following situations, create a scatterplot of the data and describe the nature, direction, and strength of the relationship.
a. A researcher hypothesizes a positive relationship between the number of children in a family and the number of televisions a family owns.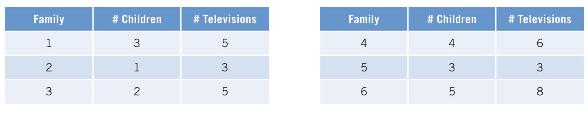
b. Is there a relationship between the amount of time spent watching sports on television and the amount of time actually playing sports? The following data are from a small sample of children who reported their average number of daily hours spent watching sports on television and playing sports.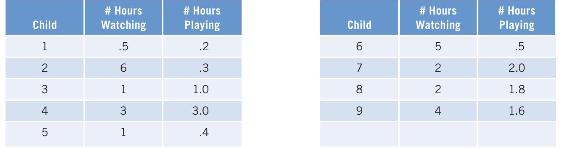
c. A test developer gives people two versions of a survey (a longer version that contains 40 items and a shorter version that contains 20 items) and wants to see if scores on the two versions are related to each other.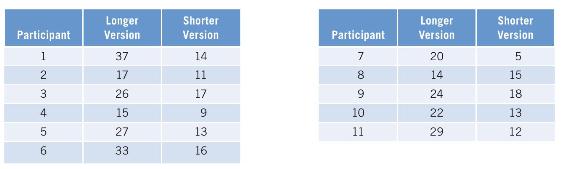
a. A set of parents hypothesize there is a negative relationship between the average number of hours their children spend on the Internet and their scores on a recent school quiz (range \(=0-100\) ).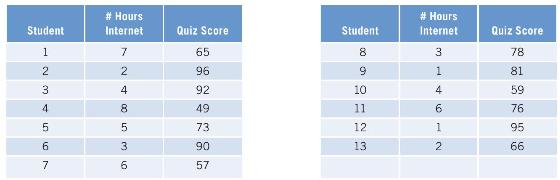
b. A college counselor hypothesizes that the farther students live from campus (in miles), the less they feel they are part of the school community \((1=\) low, \(10=\) high \()\).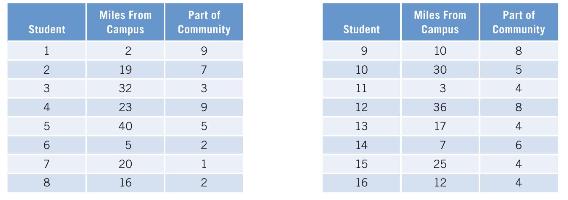
c. A publishing company develops a new college admissions test and hypothesizes that scores on the test are positively related to academic achievement in college. The company administers the test to a sample of college students (possible scores range from \(0-100)\) and collects college grade point averages 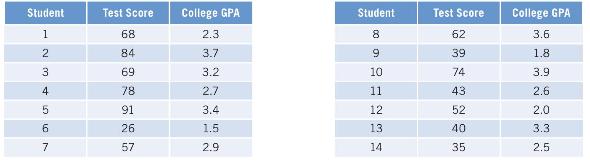
Step by Step Answer:


Fundamental Statistics For The Social And Behavioral Sciences
ISBN: 9781506377476
2nd Edition
Authors: Howard T Tokunaga
