

Question: In Chapter 16 we had three different examples from a study by Spilich et al. (1992) in which we compared three groups on the basis
In Chapter 16 we had three different examples from a study by Spilich et al. (1992) in which we compared three groups on the basis of smoking behavior. We can set this design up as a 3 × 3 factorial by using Task as one variable and Smoking group as the other.
The dependent variable was the number of errors the participant made on that task.
These data are repeated on the next page.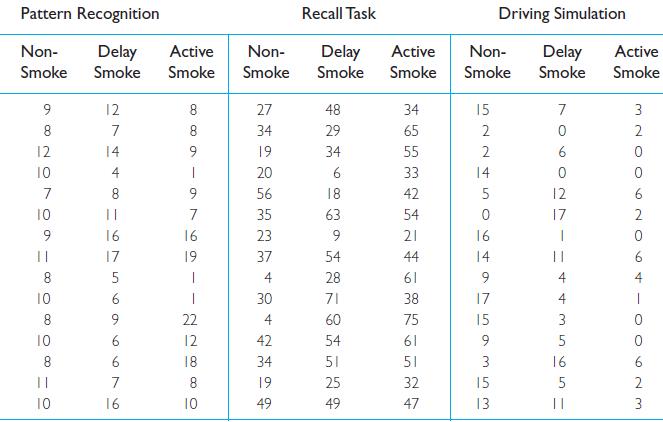
Plot the cell means for this design.
Pattern Recognition Recall Task Driving Simulation Non- Delay Active Smoke Smoke Non- Delay Active Non- Delay Active Smoke Smoke Smoke Smoke Smoke Smoke Smoke 9 12 8 7 12 10 20 14 888 27 48 34 15 7 34 29 65 2 0 9 19 34 55 2 6 4 7 8 10 || 9 16 16 17 19 -9469 20 6 33 14 0 56 18 42 5 12 7 35 63 54 0 17 23 9 21 16 37 54 44 14 8 5 4 28 61 9 10 6 30 71 38 17 4 8 9 22 4 60 75 15 10 12 42 8 6 18 7 8 10 16 10 49 2199 54 61 34 51 25 49 5+ 51 32 15 47 563553 3 9 5 3 16 5 13 || 320062064-00623
Step by Step Solution
3.31 Rating (154 Votes )
There are 3 Steps involved in it

Get step-by-step solutions from verified subject matter experts