In the fall of 1998, the National Center for Education Statistics (NCES) established a cohort of kindergarten
Question:
In the fall of 1998, the National Center for Education Statistics (NCES) established a cohort of kindergarten students based on a random sample of all kindergarten students throughout the United States. Objective reading and math assessments were administered to the students in kindergarten, first grade, third grade, and fifth grade. Note: Science assessments were also administered, but we do not present those results here. Subjective assessments were also obtained by teacher ratings of each student. The teacher rating was translated into an Academic Rating Scale (ARS) from 0 to 4, where 0 indicates no understanding of the content and 4 indicates complete mastery of the content. The ARS serves as a grade the teacher would assign the student. Teachers were unaware of the students’ objective test scores.
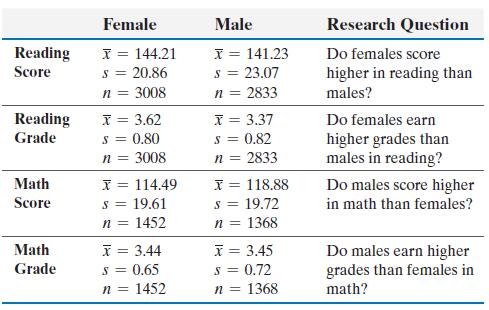
(a) The goal of the research is to demonstrate whether the objective scores correspond with the subjective grades received by the teacher in the class. For example, if females score higher in Reading, do females also earn better grades (ARS scores) in Reading? The table below summarizes the results for objective test scores and ARS scores. Perform the appropriate test to answer each research question.
(b) Teachers were also asked to rate each student’s classroom behavior. This included engagement in the classroom, how often the student lost control, and the student’s interpersonal skills. The NCES used the results of these questions to establish a Social Rating Scale (SRS) as a way to measure the student’s approach to learning. The SRS scale ranges from 0 to 3, with a higher SRS representing a higher approach to learning. For fifth-grade females the mean SRS is 2.30 with a standard deviation of 0.60 (n = 2995), and for fifth-grade males the mean SRS is 1.94 with a standard deviation of 0.67 (n = 2820). Does the evidence suggest females received a higher SRS score than males?
(c) Write some overall conclusions based on your data analysis in parts (a) and (b).
Step by Step Answer:


