The graph shows how r G varies with temperature for three different oxidation reactions: the oxidations
Question:
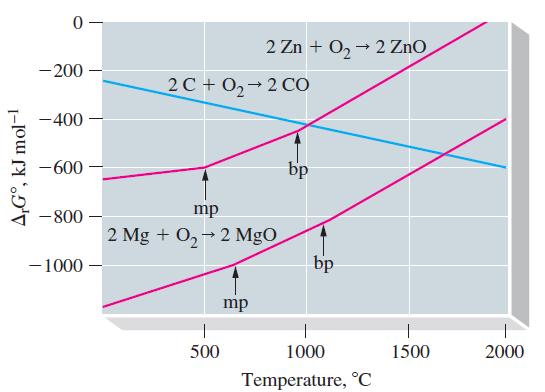
The graph shows how ΔrG° varies with temperature for three different oxidation reactions: the oxidations of C(graphite), Zn, and Mg to CO, ZnO, and MgO, respectively. Such graphs as these can be used to show the temperatures at which carbon is an effective reducing agent to reduce metal oxides to the free metals. As a result, such graphs are important to metallurgists.
Use these graphs to answer the following questions.
(a) Why can Mg be used to reduce ZnO to Zn at all temperatures, but Zn cannot be used to reduce MgO to Mg at any temperature?
(b) Why can C be used to reduce ZnO to Zn at some temperatures but not at others? At what temperatures can carbon be used to reduce zinc oxide?
(c) Is it possible to produce Zn from ZnO by its direct decomposition without requiring a coupled reaction? If so, at what approximate temperatures might this occur?
(d) Is it possible to decompose CO to C and O2 in a spontaneous reaction? Explain.

(e) To the set of graphs, add straight lines representing the reactions

given that the three lines representing the formation of oxides of carbon intersect at about 800 °C. The slopes of the three lines described above differ sharply. Explain why this is so—that is, explain the slope of each line in terms of principles governing Gibbs energy change.
(f) The graphs for the formation of oxides of other metals are similar to the ones shown for Zn and Mg; that is, they all have positive slopes. Explain why carbon is such a good reducing agent for the reduction of metal oxides.
Step by Step Answer:

General Chemistry Principles And Modern Applications
ISBN: 9780132931281
11th Edition
Authors: Ralph Petrucci, Jeffry Madura, F. Herring, Carey Bissonnette


