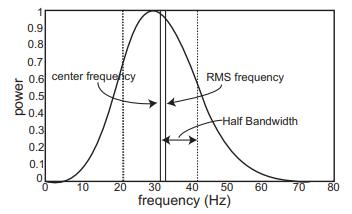
Figure 3.15 shows the power spectrum of a (30 mathrm{~Hz}) Ricker wavelet denoted with the center frequency,
Question:
Figure 3.15 shows the power spectrum of a \(30 \mathrm{~Hz}\) Ricker wavelet denoted with the center frequency, the bandwidth, and the root-mean-square frequency. The two dashed lines are equidistance from the centralfrequency, and the distance between them is twice the spectral bandwidth.
(a) How many octaves of this spectrum are there in your estimate?
(b) Why is the center frequency not at the position of the peak amplitude?
(c) How would you define the spectral bandwidth for this case?
(d) How is the rms frequency defined?
Figure 3.15

Fantastic news! We've Found the answer you've been seeking!
Step by Step Answer:
Related Book For 

Question Posted:


