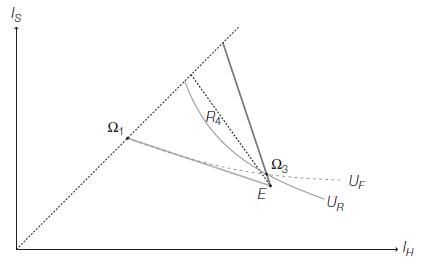
Review Figure 9.18, which depicts a separating equilibrium breaking down. In this figure, the separating equilibrium breaks
Question:
Review Figure 9.18, which depicts a separating equilibrium breaking down. In this figure, the separating equilibrium breaks down because the zero-profit line is too far to the right. But this is not the only way that a separating equilibrium can fail.

a. Draw a version of the Rothschild–Stiglitz model where a separating equilibrium holds, but just barely (the robust-type indifference curve should almost touch the aggregate zero-profit line).
b. Imagine that all the robust types in the insurance market suddenly become much more risk-averse. How would this change the shape of their indifference curves?
Show how this change can unravel the separating equilibrium.
Fantastic news! We've Found the answer you've been seeking!
Step by Step Answer:
Related Book For 

Question Posted:


