=+2 Plot a graph of the variable costs and another graph of the fixed costs of CM.
Question:
=+2 Plot a graph of the variable costs and another graph of the fixed costs of CM. Your graphs should be similar to Figure 2-2, panel
Step by Step Answer:
Related Book For 

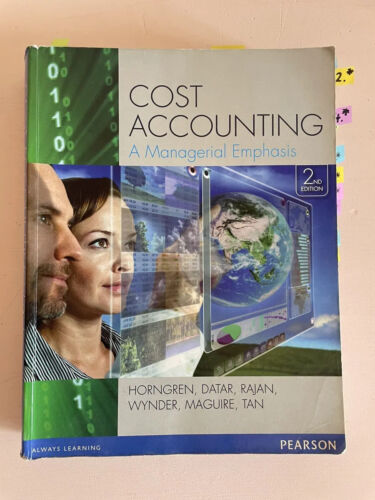
Cost Accounting A Managerial Emphasis
ISBN: 9781442563377
2nd Edition
Authors: Monte Wynder, Madhav V. Rajan, Srikant M. Datar, Charles T. Horngren, William Maguire, Rebecca Tan
Question Posted:


