

OLS linear regression (continuation of Exercise 10-16). Using Excel, plot the actual values of the predictor variable
Question:
OLS linear regression (continuation of Exercise 10-16). Using Excel, plot the actual values of the predictor variable Y (in $ millions) from Exercise 10-16 as a bar chart and add a trendline.
REQUIRED 1. What does this step of the specification analysis tell a management accountant?
2. How would a management accountant interpret this new information? What is the next step?
3 Below is the plot of the residuals. How would a management accountant interpret this new information?LO1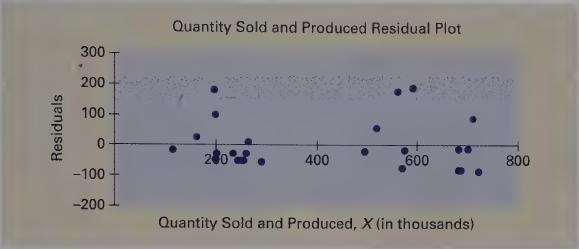
Step by Step Answer:

This question has not been answered yet.
You can Ask your question!
Related Book For 

Cost Accounting A Managerial Emphasis
ISBN: 9780135004937
5th Canadian Edition
Authors: Charles T. Horngren, Foster George, Srikand M. Datar, Maureen P. Gowing
Question Posted:
