Organizing data, high-low method. Ken Howard, financial analyst at JVR Corporation, a manufacturer of precision
Question:
Organizing data, high-low method. Ken Howard, financial analyst at JVR Corporation, a © —
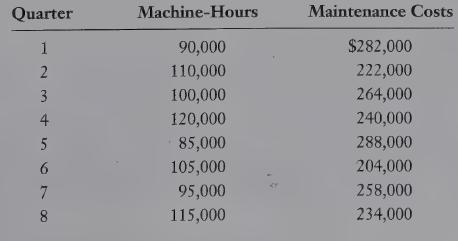
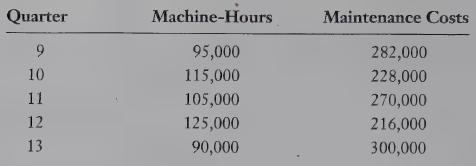
manufacturer of precision parts, is examining the behaviour of quarterly maintenance costs for budgeting purposes. Howard collects the following data on machine-hours worked and maintenance costs for the past 13 quarters:

REQUIRED 1
a. Using Excel, do a regression analysis to estimate and plot the quarterly data underlying the cost function: Maintenance costs = a + (b x Machine-hours).
b. Estimate the cost function for the data represented by the plots in requirement 1
(a) using the high-low method.
c. How well does each cost function fit the data?
2
a. Using Excel, do a regression analysis to estimate and plot the quarterly data relating machine-hours in a quarter (¢, say) to maintenance costs in the following quarter (t + 1).
That is, plot machine-hours in quarter 1 against maintenance costs in quarter 2, machine-hours in quarter 2 against maintenance costs in quarter 3, and so on.
b. Estimate the cost function for the data represented by the plots in requirement 2
(a) using the high-low method.
c. How well does each cost function fit the data? *
3. Howard anticipates that JVR will operate machines for 95,000 hours in quarter 14. Calculate the predicted maintenance costs in quarter 14 using the cost functions estimated in requirements 1
(b) and 2(b). What maintenance costs should Howard budget for quarter 14?
Explain your answer briefly.LO1
Step by Step Answer:

Cost Accounting A Managerial Emphasis
ISBN: 9780135004937
5th Canadian Edition
Authors: Charles T. Horngren, Foster George, Srikand M. Datar, Maureen P. Gowing


