

3 Ten samples of 15 parts each were taken from an ongoing process to establish ap chart...
Question:
3 Ten samples of 15 parts each were taken from an ongoing process to establish ap chart for con- trol. The samples and the number of defectives in each are shown in the following table:
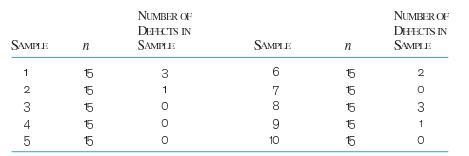
a. Develop ap chart for 95 percent confidence (1.96 standard deviations).
b. Based on the plotted data points, what comments can you make?
Fantastic news! We've Found the answer you've been seeking!
Step by Step Answer:

Answered By
Ajay Negi
Hi, I've completed my degree in engineering (Information Technology) from an NIT. Currently working as a software engineer. Wish to impart quality education to the future generation.
2+ Reviews
10+ Question Solved
Related Book For 

Operations Management For Competitive Advantage
ISBN: 1572
11th Edition
Authors: Richard B. Chase, F. Robert Jacobs
Question Posted:
