

6 The following diagram shows the flow process, raw material costs, and machine processing time for three
Question:
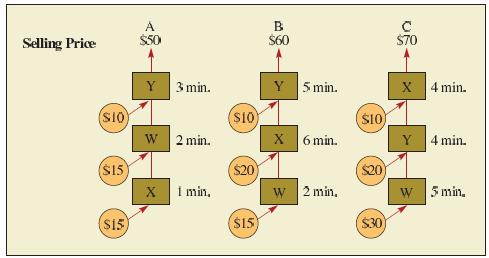
6 The following diagram shows the flow process, raw material costs, and machine processing time for three products: A, B, and C. There are three machines (W,X, and Y) used in the production of these products; the times shown are in required minutes of production per unit. Raw material costs are shown in cost per unit of product. The market will take all that can be produced.
a. Assuming that sales personnel are paid on a commission basis, which product should they sell?
b. On the basis of maximizing gross profit per unit, which product should be sold?
c. To maximize total profit for the firm, which product should be sold?
Fantastic news! We've Found the answer you've been seeking!
Step by Step Answer:

Answered By
Muhammad Ghyas Asif
It is my obligation to present efficient services to my clients by providing a work of quality, unique, competent and relevant. I hope you have confidence in me and assign me the order and i promise to follow all the instructions and keep time.
109+ Reviews
203+ Question Solved
Related Book For 

Operations Management For Competitive Advantage
ISBN: 1572
11th Edition
Authors: Richard B. Chase, F. Robert Jacobs
Question Posted:
