

Question: Best Buy Co, Inc., is a leading retailer specializing in consumer electronics. A condensed income statement and balance sheet for the fiscal year ended January
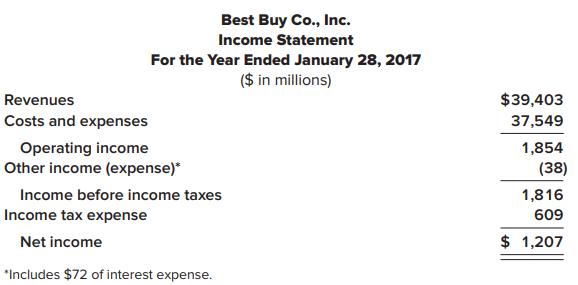
Best Buy Co, Inc., is a leading retailer specializing in consumer electronics. A condensed income statement and balance sheet for the fiscal year ended January 28, 2017, are shown next.
Liquidity and solvency ratios for the industry are as follows:
Industry Average
Current ratio 1.43
Acid-test ratio 1.15
Debt to equity 0.68
Times interest earned 8.25 times
Required:
1. Determine the following ratios for Best Buy for its fiscal year ended January 28, 2017.
a. Current ratio
b. Acid-test ratio
c. Debt to equity ratio
d. Times interest earned ratio
2. Using the ratios from requirement 1, assess Best Buy’s liquidity and solvency relative to its industry
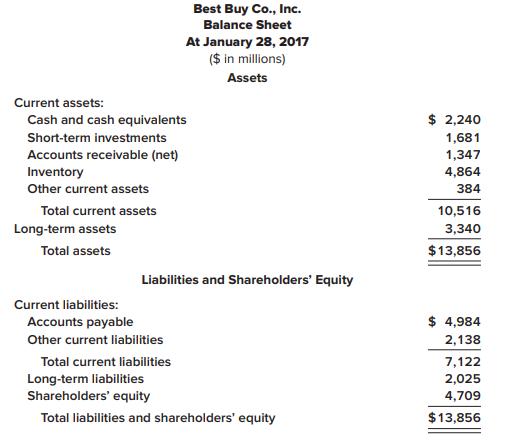
Best Buy Co., Inc. Balance Sheet At January 28, 2017 ($ in millions) Assets Current assets: Cash and cash equivalents $ 2,240 Short-term investments 1,681 Accounts receivable (net) 1,347 Inventory 4,864 Other current assets 384 Total current assets 10,516 Long-term assets 3,340 Total assets $13,856 Liabilities and Shareholders' Equity Current liabilities: Accounts payable $ 4,984 Other current liabilities 2,138 Total current liabilities 7,122 Long-term liabilities Shareholders' equity 2,025 4,709 Total liabilities and shareholders' equity $13,856
Step by Step Solution
3.28 Rating (157 Votes )
There are 3 Steps involved in it
1 Determine the following ratios for B... View full answer

Get step-by-step solutions from verified subject matter experts