

Question: For the distribution of e-mails sent by students in Exercise 11, describe the shape. Data From Exercise 11 A university teacher saved every e-mail received
For the distribution of e-mails sent by students in Exercise 11, describe the shape.
Data From Exercise 11
A university teacher saved every e-mail received from students in a large introductory statistics class during an entire term. He then counted, for each student who had sent him at least one e-mail, how many e-mails each student had sent.
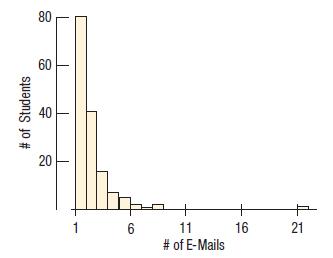
What does the histogram say about the distribution of e-mails sent by students?
# of Students 80 60 20 1 6 + 11 # of E-Mails + 16 21
Step by Step Solution
3.53 Rating (156 Votes )
There are 3 Steps involved in it
The shape entails approximately 35 and the binomial probability is approximately 086 yields a pval... View full answer

Get step-by-step solutions from verified subject matter experts