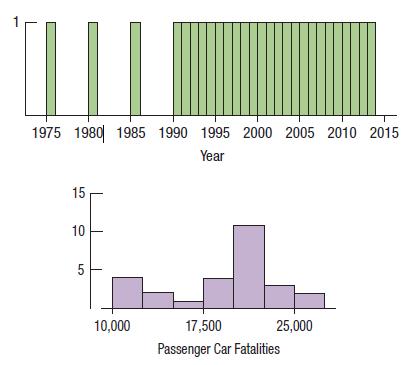
Here are two histograms showing the annual number of traffic fatalities in passenger cars. (NHTSA) One plots
Question:
Here are two histograms showing the annual number of traffic fatalities in passenger cars. (NHTSA) One plots the years, and the other plots the fatalities.

a) There are gaps in the histogram for Year. What do they indicate?
b) Why are all the bars in the Year histogram the same height?
c) Explain what the histogram says about passenger car fatalities.
Fantastic news! We've Found the answer you've been seeking!
Step by Step Answer:
Related Book For 

Intro Stats
ISBN: 9780134668420
5th Edition
Authors: Richard D De Veaux, Paul F Velleman, David E Bock, Nick Horton
Question Posted:


